The Best and Worst States for Drinking Water in America

A glass of tap water can look perfectly clear and still tell you almost nothing about how it compares with water hundreds of miles away. Across America, communities rely on different water sources, treatment plants, pipes and infrastructure, while contaminants can range from lead to agricultural runoff and PFAS. The Government Accountability Office says threats to drinking-water safety remain despite major improvements over the past 50 years. So which states come out looking best and worst? Before getting to the rankings, it helps to understand what can change between one faucet and the next.
The Problems Aren’t The Same Everywhere

One community may be dealing with aging lead pipes while another is watching contaminants seep into groundwater. NRDC has documented that contrast in places including Buffalo, where lead service lines have been a concern, Houston, where PFAS pollution has drawn attention, and California’s Central Valley, where agricultural runoff can contaminate groundwater. Those differences make comparing entire states more complicated than simply asking whether their tap water is “good” or “bad.”
Even Clear Water Can Hide Contaminants

Some drinking-water problems aren’t obvious from taste, smell or appearance. PFAS, for example, persist in the environment and have been linked to health concerns including cancer, reproductive effects, endocrine disruption and effects on the immune system. Lead can enter drinking water when service lines corrode, while farm runoff can introduce nitrates into waterways and groundwater. That’s why water-quality rankings rely on testing and compliance records rather than what comes out of the faucet looking clean.
How The 2026 Ranking Actually Works
TapWaterData’s 2026 ranking uses population-weighted averages of city-level scores derived from EPA and other water-quality data. The scoring considers contaminants exceeding federal maximum levels or health goals, the severity and frequency of violations, and overall compliance history. Crucially, coverage varies substantially by state, meaning the rankings are better understood as comparisons of available data rather than definitive judgments on every household’s water. With that caveat in place, the leaders begin to emerge.
These States Rise To The Top
North Carolina and South Dakota share the highest score at 100, followed closely by Louisiana at 99.8. Hawaii and New Hampshire both score 99.5, while Indiana, Kentucky, Alaska, Tennessee and South Carolina round out the top 10. It’s an impressive-looking group, but those perfect scores aren’t quite as straightforward as they first appear. The amount of data behind each state’s ranking makes a major difference.
North Carolina’s Win Comes With An Asterisk
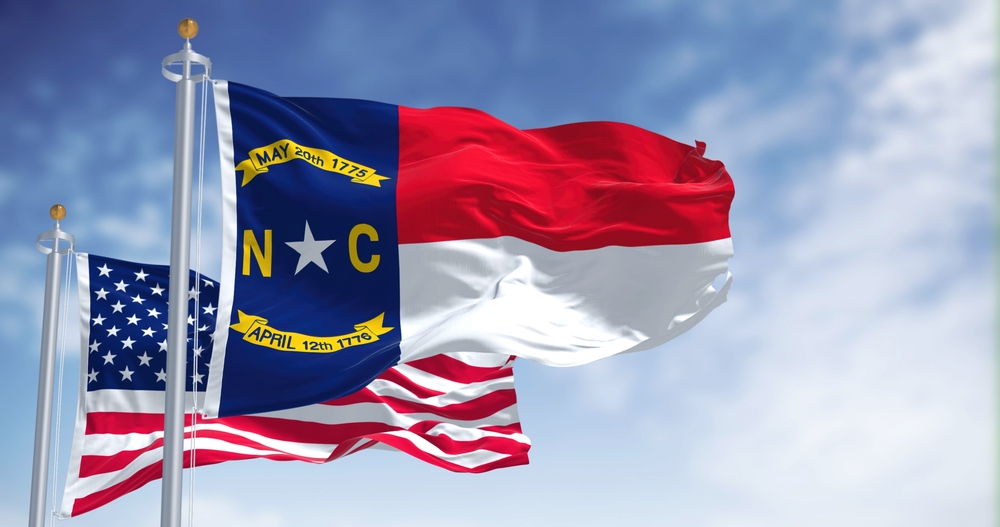
North Carolina’s first-place result is based on 11 cities and reported coverage of just 3.6%, while South Dakota’s 100-point score comes from five cities and 1.8% coverage. Hawaii’s 99.5 score, by contrast, comes with 100% coverage in the dataset. That doesn’t erase the top scores, but it does show why they shouldn’t be interpreted as proof that every faucet in those states delivers equally high-quality water. And that same caution applies at the opposite end.
New Jersey Lands At The Bottom
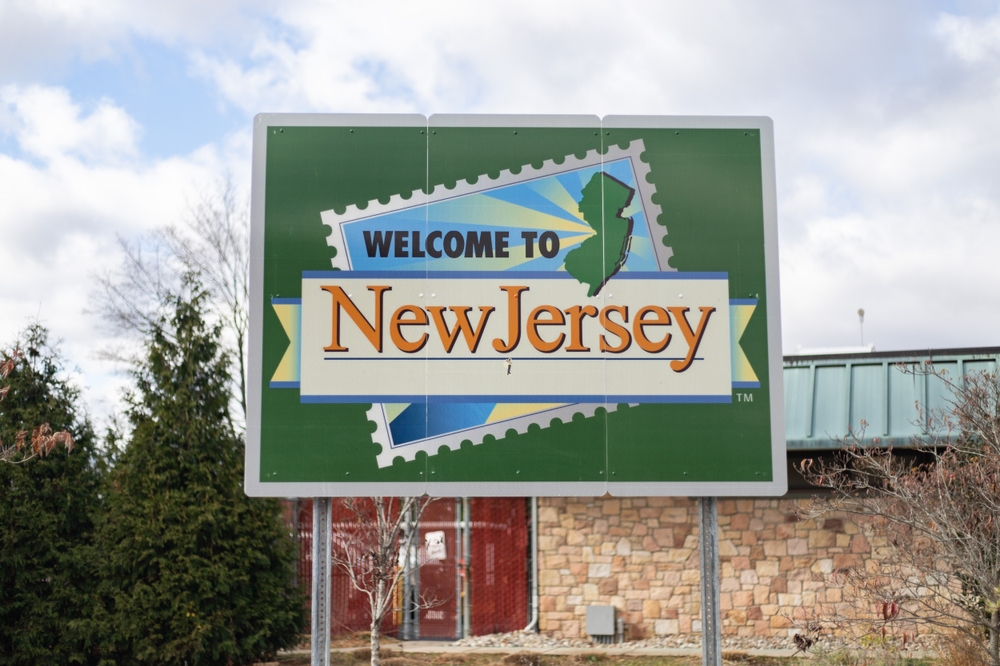
The lowest-scoring state in this particular ranking is New Jersey at 73.9, followed by Nevada at 78.1 and Illinois at 78.7. Massachusetts and Idaho tie at 80.7, with Oklahoma, Kansas, Arizona, Texas and Montana completing the bottom 10. Importantly, New Jersey still earns a B under the site’s grading system. “Worst” therefore means lowest-scoring among the states analyzed, not that every New Jersey tap is unsafe.
City Results Show An Even Wider Divide
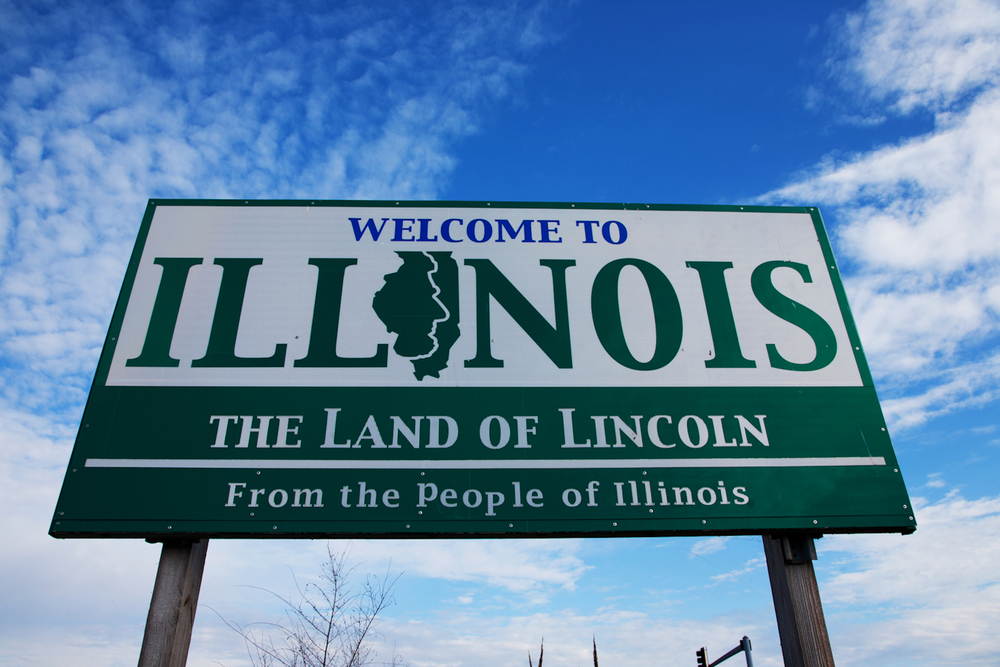
Zooming in reveals differences that state averages can blur. Among major cities identified as having the most room for improvement, Peoria, Illinois, scores 53, Worcester and Framingham, Massachusetts, each score 55, and Cedar Rapids, Iowa, scores 59.1. Iowa offers an especially useful example of why local conditions matter: Reuters reports longstanding concerns there over nitrate pollution tied to runoff, although scientists have not reached consensus on its cancer risk.
Your State Ranking Isn’t Your Water Report
Living in a highly ranked state doesn’t guarantee that a particular home’s water is problem-free, just as living in a lower-ranked state doesn’t mean every faucet is unsafe. Utilities serve different communities and water sources, while plumbing inside and leading to individual buildings can introduce additional variables. The ranking itself draws partly from annual Consumer Confidence Reports issued by utilities, making those local reports much more relevant to an individual household than a statewide score alone.
Tomorrow’s Rankings Could Look Very Different
Water quality isn’t a fixed contest with permanent winners and losers. The GAO says the country faces challenges involving PFAS, lead, aging infrastructure and other pollution, while EPA estimates more than $1 trillion will be needed for clean-water and wastewater infrastructure over the next two decades. Extreme weather can add still more pressure through drought, flooding, wildfires and saltwater intrusion. So the ranking worth watching isn’t simply who finishes first or last, but whether communities can keep their water improving as the challenges flowing toward America’s taps continue to change.