Stock Market Flashes Warning as Weak Economic Data Raises Concerns About Trump’s Policies


The S&P 500 recently climbed back to a record high after tumbling 9% from its peak in March as the U.S.-Iran conflict drove oil prices to a multiyear high. On the surface, the recovery looks reassuring. But underneath it, three separate economic indicators are flashing warnings at the same time: consumer sentiment just hit its lowest reading in recorded history, inflation accelerated to its highest level in nearly two years, and the stock market’s valuation just reached a level not seen since the dot-com crash of 2000. Each signal on its own would be notable. Together, they demand attention.
American Consumers Are the Most Pessimistic on Record

The University of Michigan’s Consumer Sentiment Index has tracked how Americans feel about the economy every month for decades. In April 2026, it recorded a preliminary reading of 47.6, the lowest value in the survey’s history. For context, consumer sentiment has averaged 56.6 throughout President Trump’s second term, already well below the 93.2 average recorded during his first term. The most likely drivers of that pessimism, according to analysts, are rising prices and the general uncertainty that has built up since the administration began imposing tariffs. The Iran conflict and its impact on gas prices added further downward pressure in April.
Why Consumer Sentiment Actually Matters to Investors

Consumer sentiment is not just a mood reading. It has direct economic consequences. Consumer spending accounts for approximately two-thirds of U.S. GDP, making it the primary engine of economic growth. When people feel financially uncertain, they spend less. When they spend less, corporate revenues slow. When revenues slow, earnings disappoint. And when earnings disappoint, equity prices tend to fall. Forecasts from the Federal Reserve Bank of Atlanta show annualized GDP growth trending toward 1.3% in the first quarter of 2026, well below the 10-year average of 2.7%. Consumer sentiment was still deteriorating as of the latest reading, which suggests the slowdown may not yet be complete.
Inflation Just Accelerated to Its Highest Level in Almost Two Years
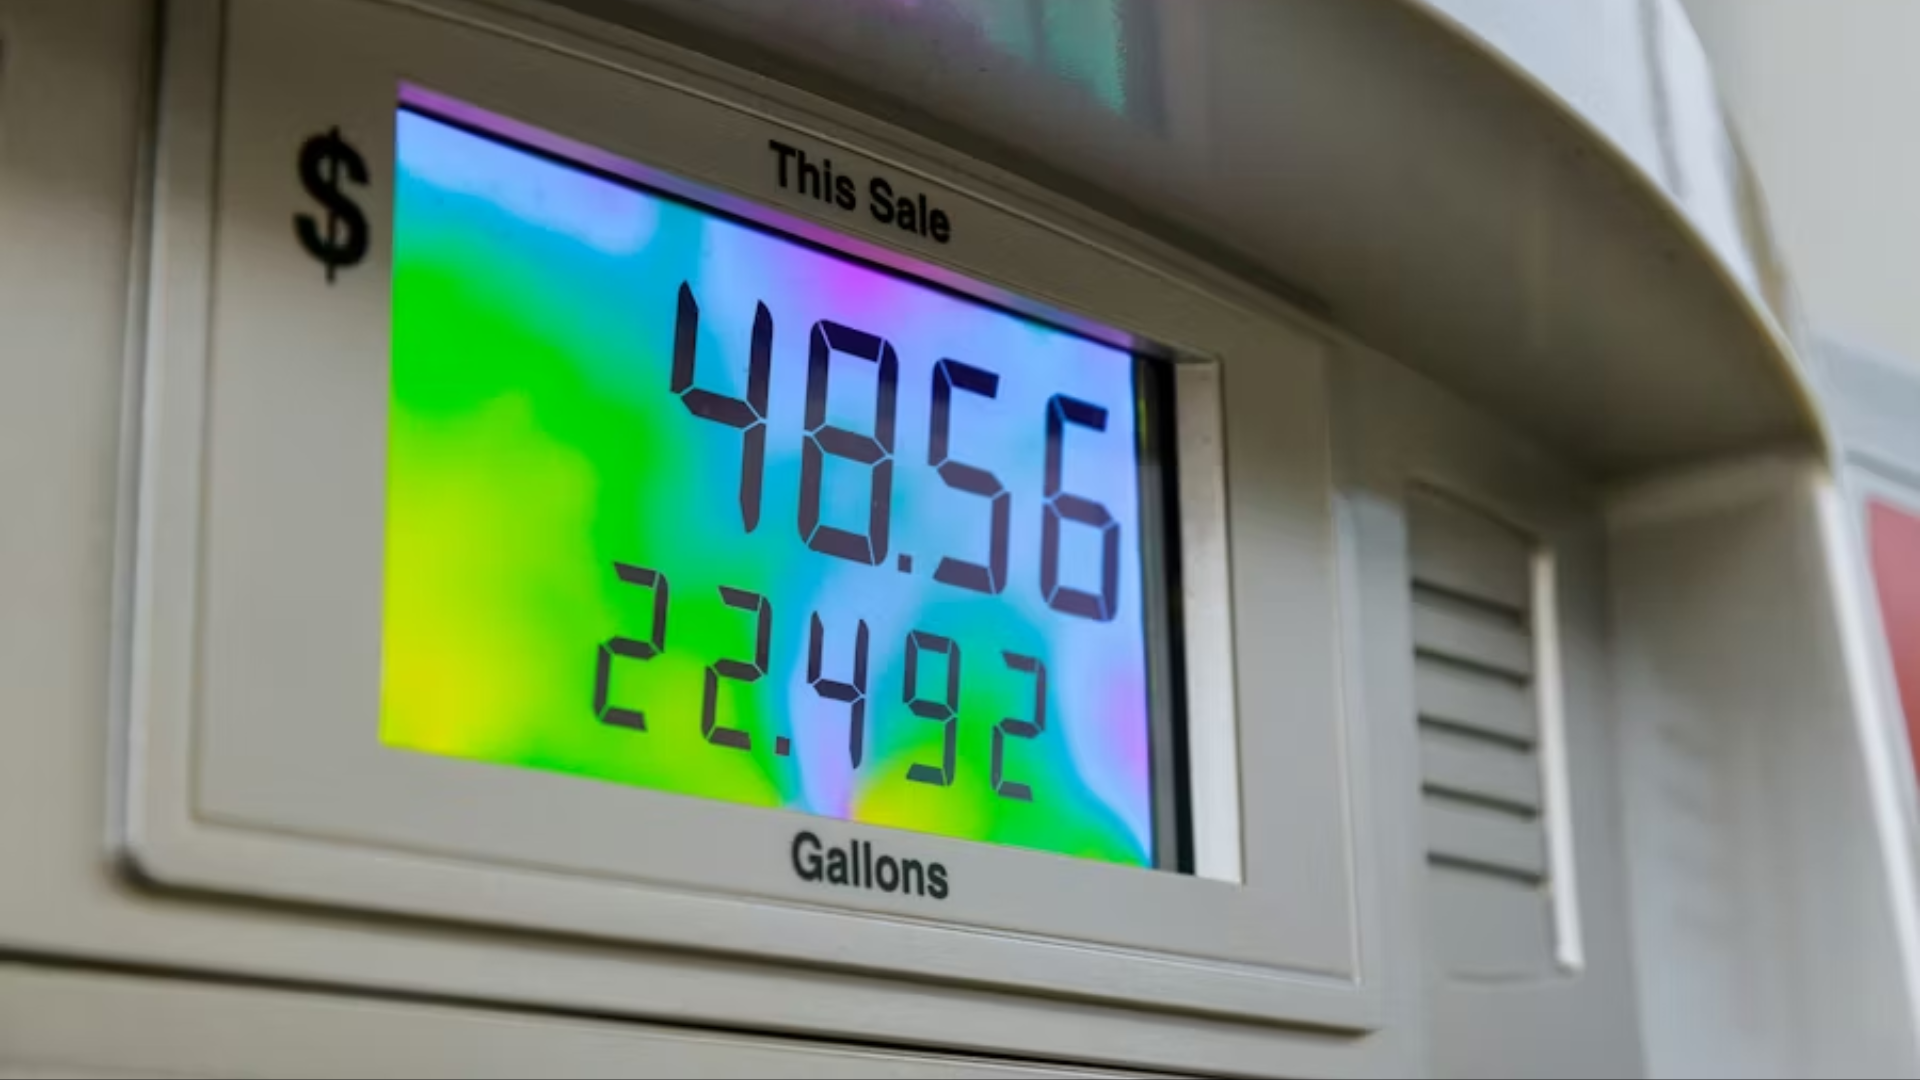
In March 2026, the Consumer Price Index rose to 3.3%, the highest reading since May 2024. The primary driver is energy costs. The Iran conflict has effectively disrupted traffic through the Strait of Hormuz, a critical waterway in the Persian Gulf that serves as a major transit route for oil and liquefied natural gas. That supply chain disruption has sent energy prices sharply higher. As of April 19, U.S. consumers were paying an average of $4.05 per gallon of regular gasoline, a price last seen in 2022. Projections from the Federal Reserve Bank of Cleveland show inflation potentially accelerating further toward 3.6% in April.
Higher Inflation Rules Out the Interest Rate Cuts Markets Were Hoping For

The inflation data matters beyond the immediate hit to household budgets because of what it signals about Federal Reserve policy. When inflation is elevated, the Fed is unlikely to cut interest rates, and may consider raising them. High interest rates make bonds more attractive relative to stocks, which tends to pull money away from equities. Markets had been pricing in the possibility of rate cuts earlier this year, which helped fuel the stock market’s recovery. That expectation now looks difficult to sustain given the March CPI reading and the Cleveland Fed’s April projection. Investors who bought back in expecting rate relief may be working from an outdated assumption.
The Stock Market Is Trading at a Valuation Not Seen Since the Dot-Com Crash
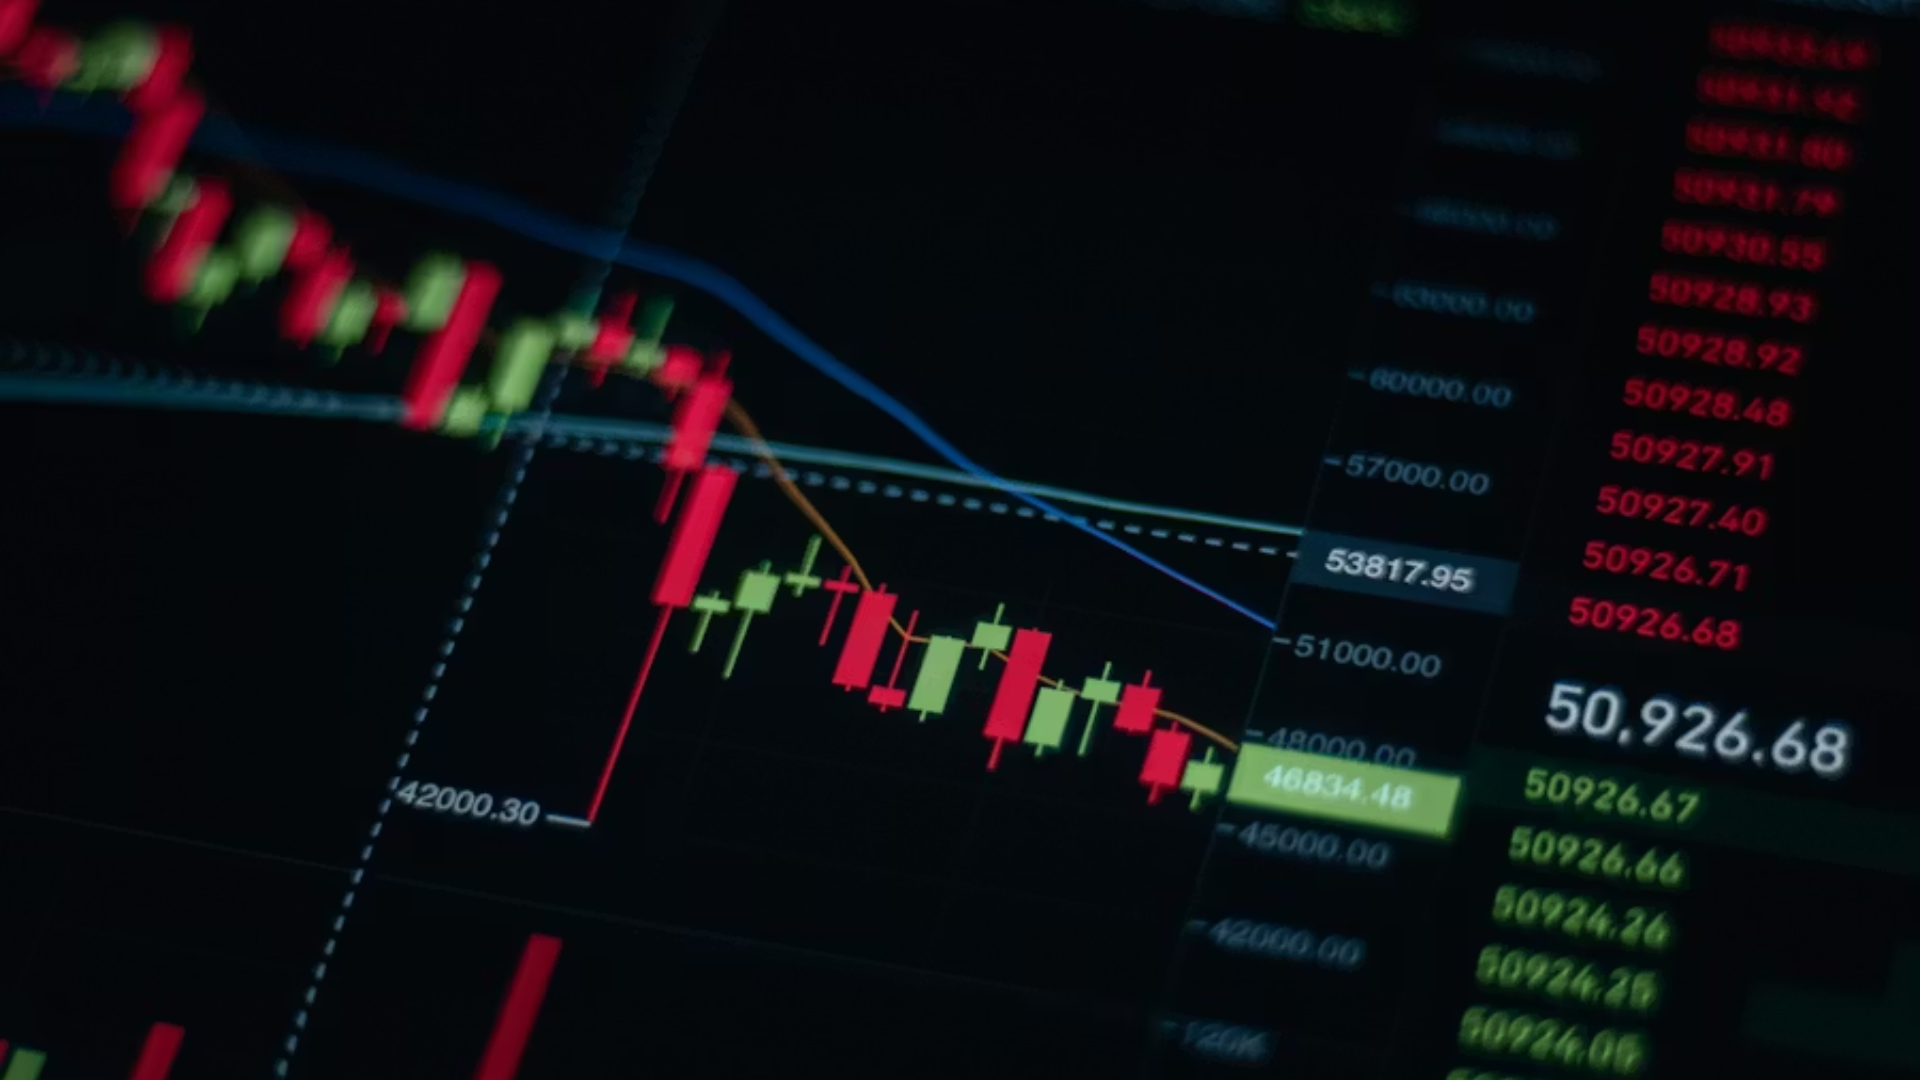
The S&P 500’s cyclically adjusted price-to-earnings ratio, known as the CAPE ratio, currently stands at 39.5. The CAPE ratio measures stock prices relative to average inflation-adjusted earnings over the previous 10 years, providing a longer-term view of valuation than standard price-to-earnings metrics. A reading of 39.5 is one of the highest in the index’s history. Apart from the past few months, the last time the monthly CAPE ratio was this elevated was during the dot-com crash in late 2000, a period that preceded years of significant market losses. That historical comparison is one analysts are watching closely.
What History Shows Happens After the CAPE Ratio Hits This Level

Data compiled from the research of economist Robert Shiller shows a consistent pattern following months when the S&P 500’s CAPE ratio exceeded 39. Looking at the best, worst, and average returns across subsequent periods, the one-year average return was negative 4%, with a worst case of negative 28%. The two-year average return was negative 20%, with a worst case of negative 43%. The three-year average return was negative 30%, with a worst case of negative 43%. Critically, the S&P 500 has never achieved a positive three-year return following a monthly CAPE reading above 39. That does not guarantee losses, but the historical record is consistent.
There Is a Counterargument Worth Hearing
The CAPE ratio has a meaningful limitation: it is a backward-looking measure based on the past decade of earnings, and it does not account for future changes in profitability. If artificial intelligence significantly expands corporate profit margins and drives faster earnings growth over the coming years, the S&P 500 could sustain its current price levels while its CAPE ratio gradually falls to a more historically normal range. That is a genuinely plausible scenario, particularly given the pace of AI adoption across major industries. Investors who dismissed elevated valuations during past technology transformations sometimes paid a price for their caution. That possibility deserves to be part of the analysis.
Three Problems Compounding Each Other at Once

What makes the current economic picture more concerning than any single indicator would suggest is the way the three warning signs interact. A historically pessimistic consumer is less likely to spend, which slows growth. Accelerating inflation erodes purchasing power and prevents the Fed from cutting rates, which adds pressure on both consumers and businesses. And an expensively valued stock market has limited room to absorb earnings disappointments without a significant correction. These conditions are not independent of each other. They reinforce each other in ways that could amplify the impact of any single negative development in the months ahead.
The Market Is Near Its High. That Does Not Mean the Risk Is Low.

The S&P 500 trading near a record high while simultaneously flashing valuation warnings, recording historically low consumer sentiment, and absorbing rising inflation is an unusual combination. Record highs can create the impression that the market has already priced in the risks and moved past them. The data suggests that conclusion may be premature. None of the warning signs discussed here guarantee a decline. Markets can remain expensive and resilient longer than logic suggests they should. What the evidence does support is a straightforward observation: the risk profile for U.S. equities is meaningfully higher today than it appeared at the start of the year.