Gen Z Parents Plan to Spend 22% More on Back-to-School Than Millennials This Year
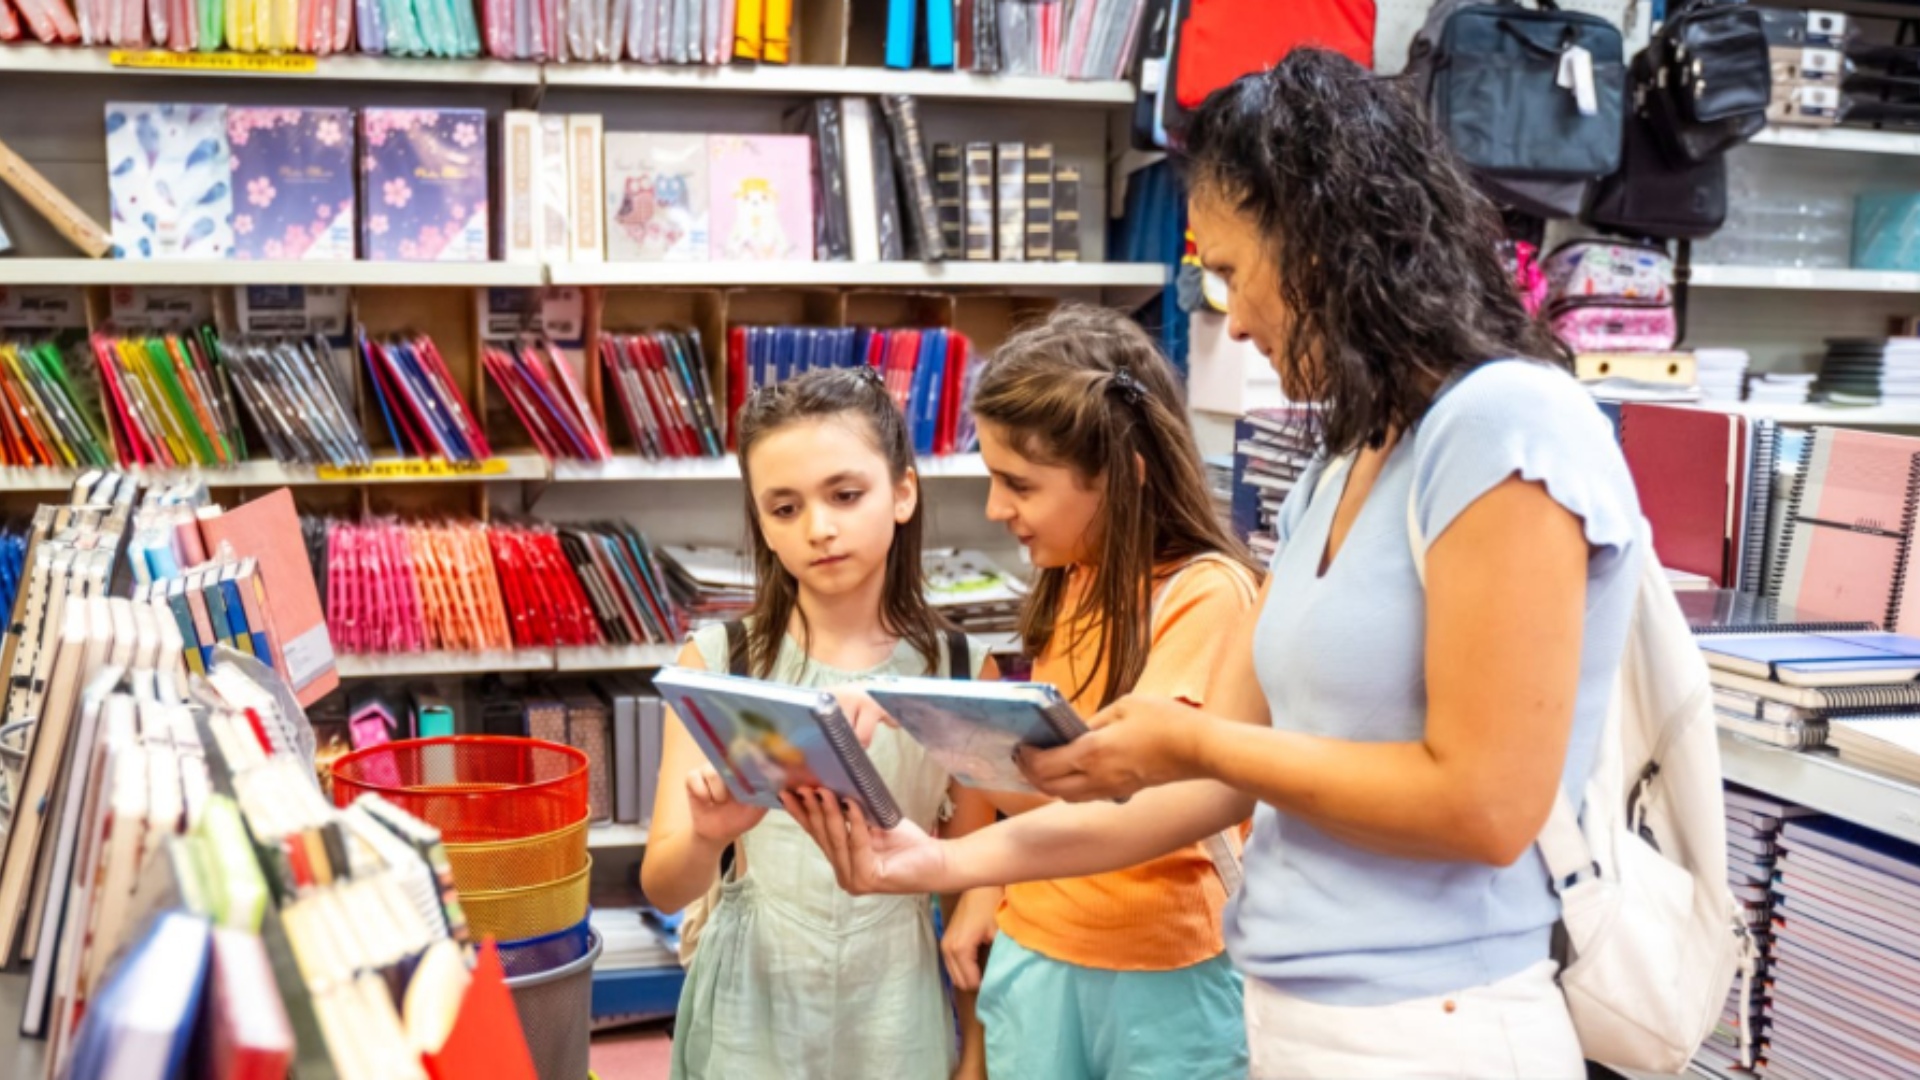

A back-to-school budget used to scale down as parents got younger and earned less. That pattern is breaking. According to JLL’s 2026 Back-to-School Shopping Report, Gen Z parents now plan to spend $671 per child this year, noticeably more than the $549 Millennial parents plan to spend. Both figures grew at roughly the same rate, about 18 percent, compared to last year. The gap between generations is not about growth rate, it is about how much each group was already spending.
The National Average Budget Grew Nearly 12 Percent This Year

Back-to-school spending overall is climbing at a healthy clip, even setting aside generational differences. JLL surveyed 1,022 parents in May 2026 and found the average planned budget reached $489 per child, up 11.7 percent from $437 last year. Higher-income households drove last year’s spending surge. This year, middle-income families are doing most of the heavy lifting, a shift that suggests the growth is broadening rather than concentrating at the top.
Boomers Are the Only Generation Actually Cutting Back

Not every age group is spending more this season. Boomer-aged parents, who are often shopping for older or college-age children, remain the sole generation planning to spend less than they did last year. Gen Z and Millennial parents continue to spend the most overall, and their budgets are growing the fastest too. That contrast highlights how differently back-to-school spending behaves depending on a child’s age and a parent’s stage of life.
Clothing Still Eats the Biggest Share of Every Budget

Where the money actually goes has stayed fairly predictable. Clothing and uniforms account for the largest single share of back-to-school spending, at $189 per child, or 28 percent of the total budget. Electronics follow at $151, or 22 percent, with home furnishings close behind at $125, or 18 percent. Nearly every family buys clothing and supplies annually, while electronics and furnishings show up mainly for families with older or college-bound students.
Inflation Worry Barely Budged, But Who Is Worried Changed Completely
Overall concern about inflation held almost perfectly steady this year, with 64.4 percent of parents saying it will influence their shopping, compared to 65.2 percent last year. What shifted is which households are carrying that worry. Affluent parents, who led concerns last year, have grown noticeably less anxious. Lower-income households now report the greatest financial pressure instead, even as their overall share of the worried group barely changed year to year.
A JLL Researcher Says Mass Merchandisers Are Winning on Two Fronts at Once
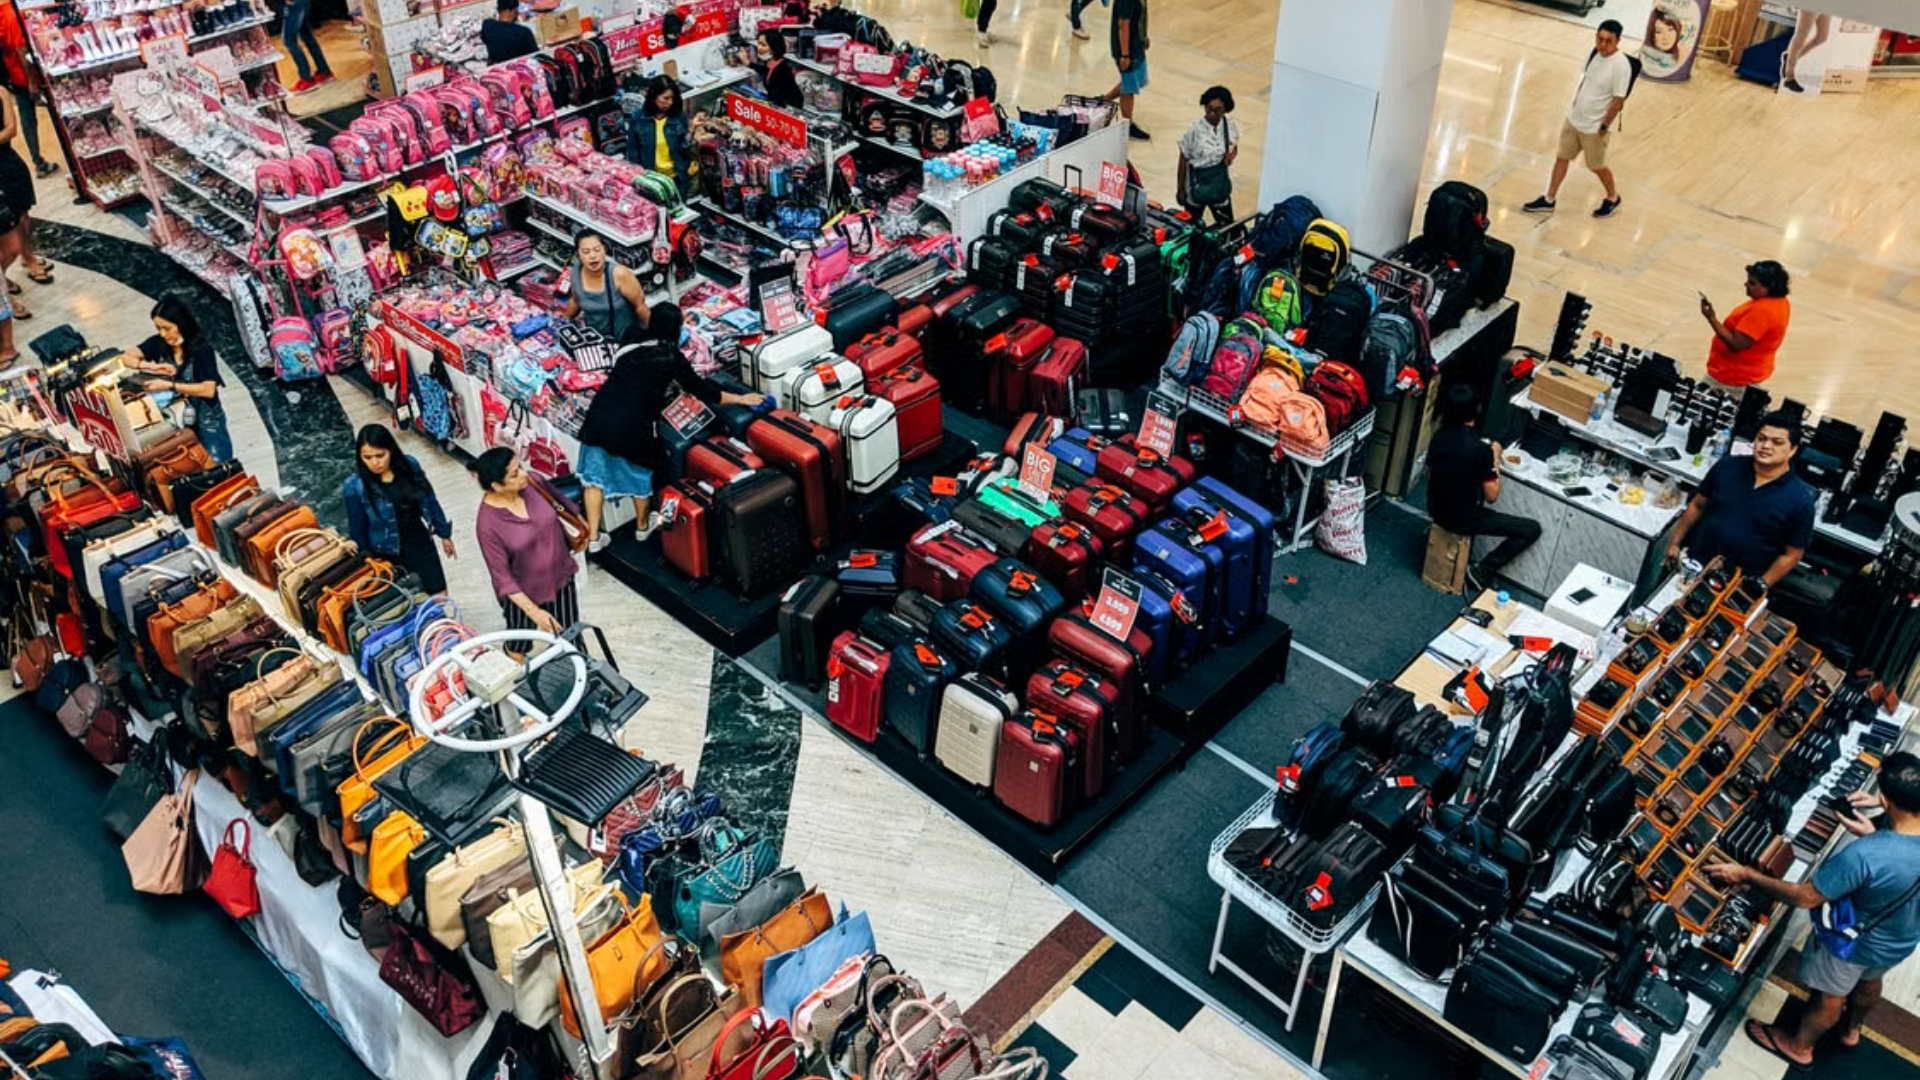
Retail researchers see a clear reason certain stores are pulling ahead this season. “Families are seeking retailers that respect their time and budgets, which explains why 68.7% cite saving money and 35.1% prioritize finding the full school list in one place,” said James Cook, JLL’s Americas director of research for retail. “Mass merchandisers are the favorites this season because they solve both priorities at once,” he added, pointing directly to Walmart’s dominant 77.3 percent share of shoppers.
Parents Pushed Their Shopping Later This Year, on Purpose

Panic buying defined last year’s back-to-school season, and this year looks noticeably calmer. Just 36.7 percent of parents said they expect to start shopping before June, down sharply from 44.8 percent a year earlier. July has reemerged as the busiest shopping month instead. Early shopping has not disappeared entirely, families preparing laptops, textbooks, and dorm furnishings for older students still tend to start sooner out of genuine planning necessity.
Physical Stores Still Dominate, but Shoppers Want Fewer Stops
Online shopping has not taken over back-to-school the way some retailers expected. More than three-quarters of parents plan to shop in physical stores this season, compared to just 13.1 percent who shop exclusively online. Parents are also consolidating their trips, relying on fewer retailers than they did a year ago. That preference for efficiency over comparison shopping is reshaping which stores can realistically compete for a family’s entire school list.
Not Every Shopper Sticks to the $489 Average

The national average budget hides some dramatic differences between shopper types. Value-focused shoppers average $444 per child and typically visit only two or three stores total. Parents buying electronics and home goods for older or college-bound kids, by contrast, spend $800 to $900 per child on average, visiting closer to six different stores. Enclosed mall shoppers land in between at $613 per child, roughly 25 percent above the overall average, drawn in by specialty options.
Value Now Means More Than Just the Lowest Price Tag
Parents have not stopped spending, they have simply gotten pickier about what makes a shopping trip worth their time. Saving money remains the top priority, but value increasingly includes convenience, product availability, and finishing an entire school list without hopping between five different stores. Retailers who understand that broader definition, rather than competing on price alone, appear best positioned as this more deliberate shopping rhythm settles in for good.