Boomers and Gen Z Now Define the ‘American Dream’ Differently


Throughout the summer of 2026, headlines kept circling the same theme from different angles. Younger generations feeling like the traditional American Dream is slipping out of reach, and reconsidering what success actually means to them. Those stories trace back to a large new survey called the 2026 New American Dream Study, conducted by the research firm Simon-Kucher. Based on responses from 5,000 adults nationwide, the report reaches a genuinely interesting conclusion. The American Dream isn’t disappearing, but it’s certainly splitting into multiple, very different versions depending on who you ask. Separate analysis of a decade of housing data adds hard numbers to that story, and the results are more surprising than a simple coastal versus heartland divide.
A Generational Split Over What Success Even Means
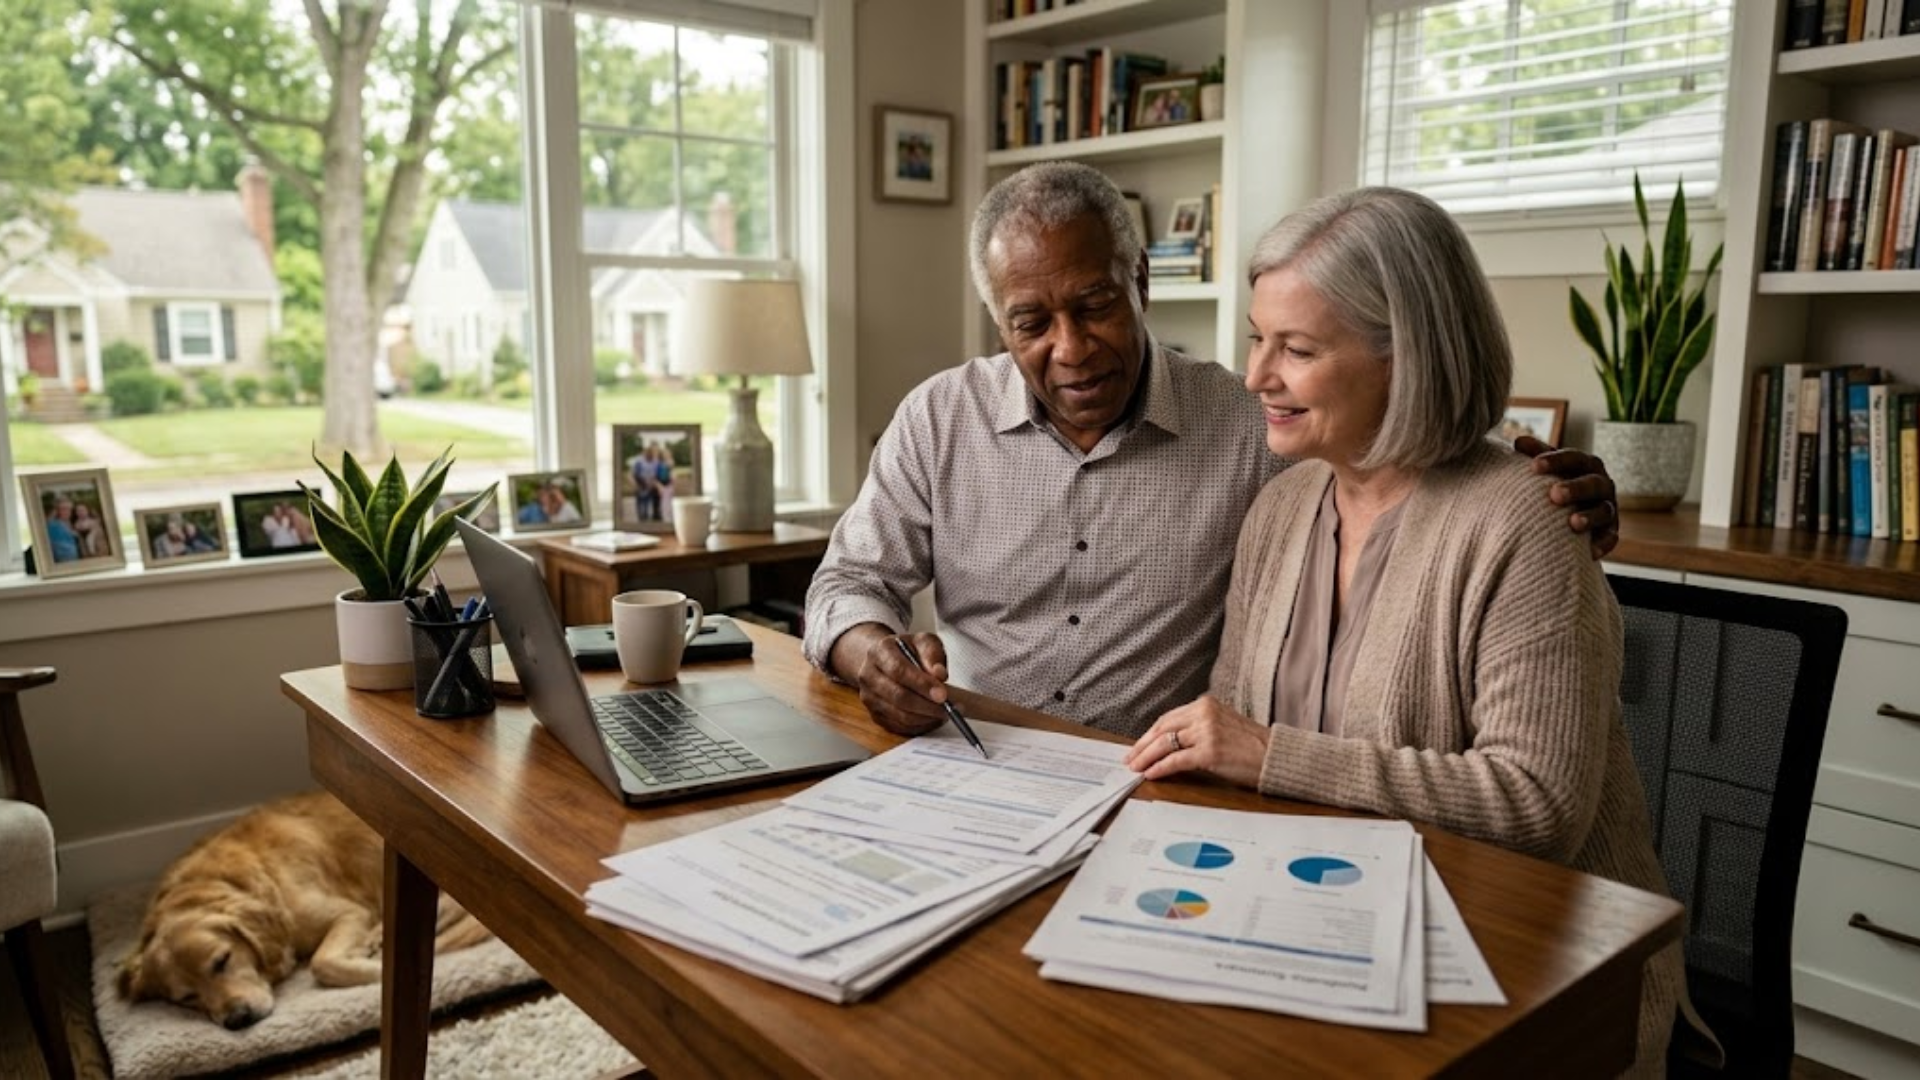
The survey found that traditional markers of success, homeownership, family, hard work, and financial stability, still matter broadly across generations. But how people weigh those priorities looks strikingly different depending on age. Baby Boomers tend to define the American Dream around stability and security, particularly retirement savings, homeownership, and financial independence. Gen Z and Millennials, by contrast, place more weight on flexibility, personal freedom, meaningful experiences, and community connection. Researchers were careful to note that younger generations aren’t rejecting the American Dream outright. They’re adapting its definition to fit a considerably more uncertain economic and social landscape than the one their parents or grandparents navigated.
The Life Decisions Younger Americans Are Actually Delaying
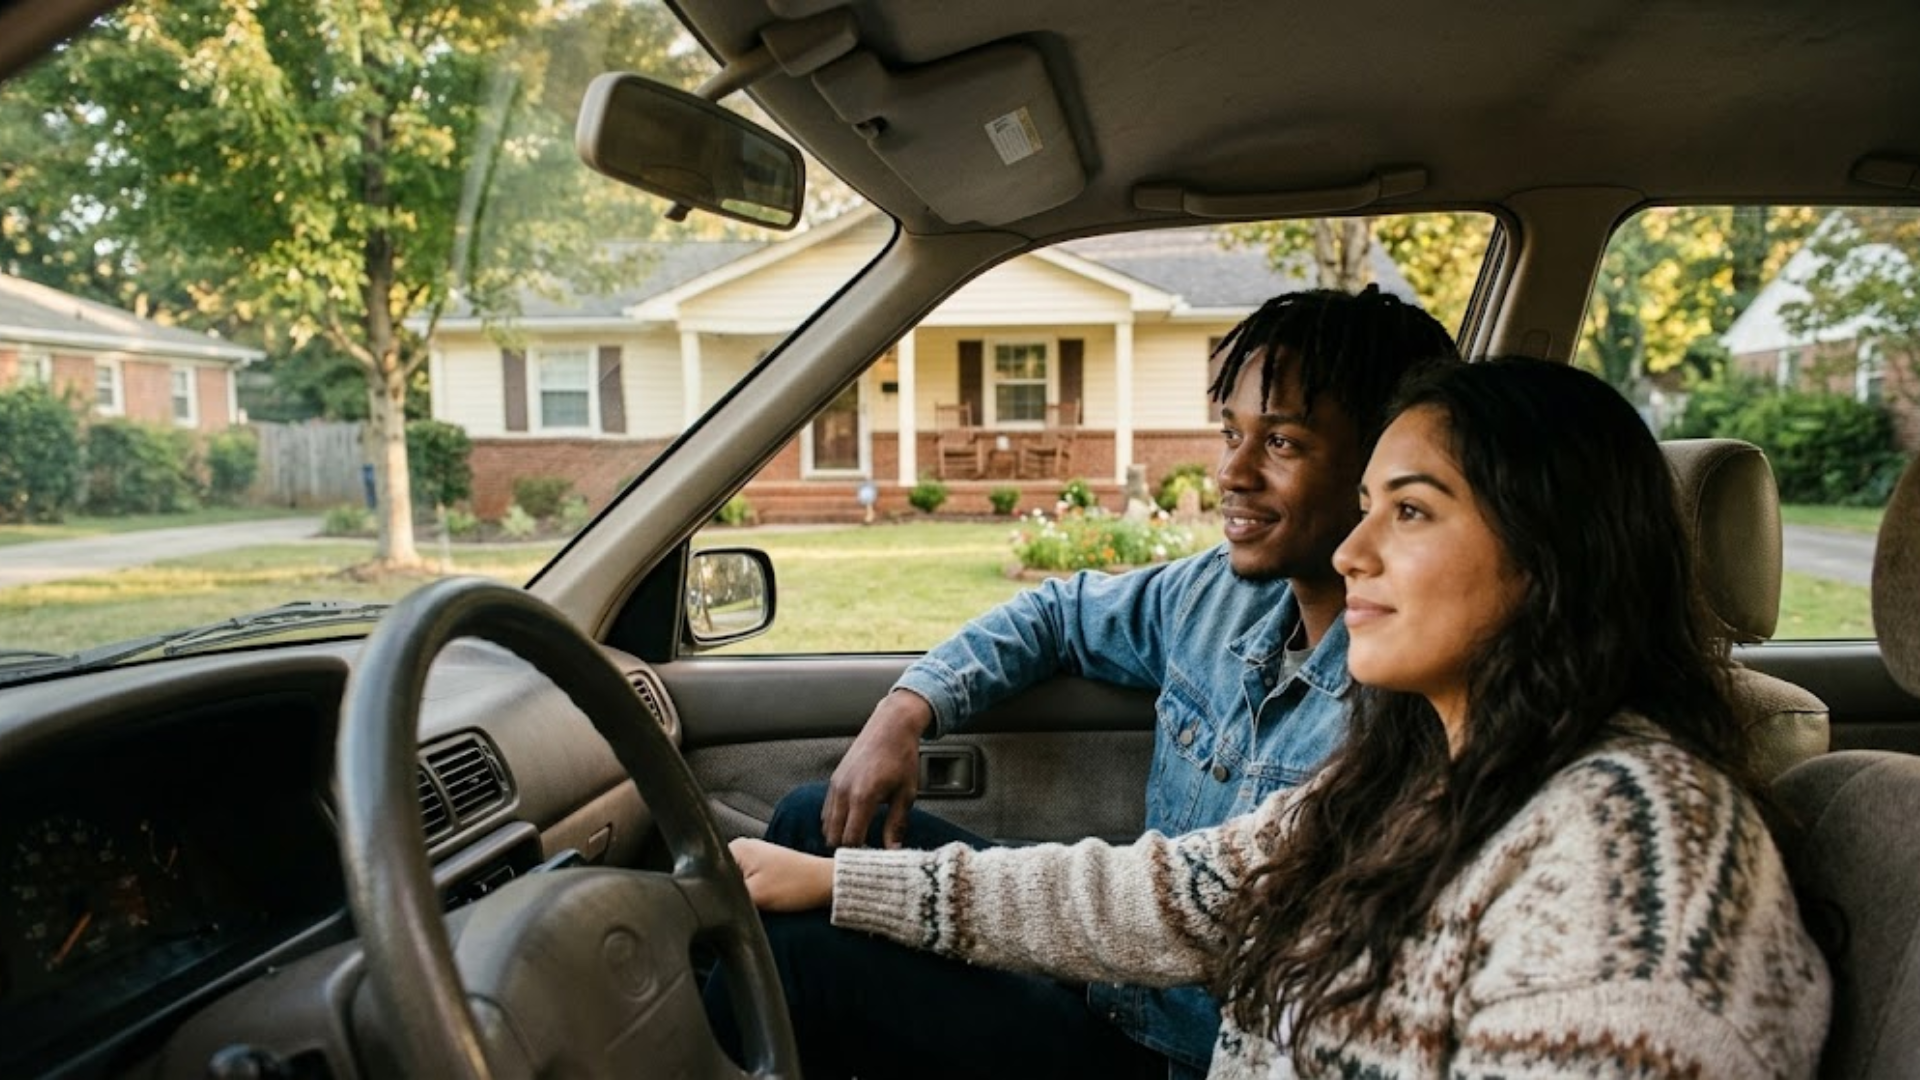
For many respondents, owning a home remains the foundational goal underneath everything else, even as it keeps slipping further out of reach. Nearly one in five aspiring homeowners said they’re delaying marriage or having children specifically until they can afford to buy a home, with similar shares putting off career changes or even getting a pet. The effect is even sharper among the youngest adults surveyed. Among Gen Z respondents between ages 18 and 28 who hope to own a home someday, 84 percent said they’re postponing at least one major life decision until homeownership becomes possible, and nearly a third are specifically delaying having children as a result.
No Single Path to the Dream Stands Out Anymore

One of the study’s more striking findings is just how unclear the route to achieving the American Dream has become. Historically, people could point to a dominant path, a four year college degree, a stable corporate career, or entrepreneurship, as the reliable way forward. That clarity has largely disappeared. No single path, whether college, entrepreneurship, skilled trades, public service, or climbing the corporate ladder, emerged as the clearly dominant route in the survey results. High living costs topped the list of obstacles respondents cited, followed closely by job insecurity, mounting debt, and a general sense of limited opportunity or confidence in their own skills.
Turning the Numbers Into a Real Affordability Gap

To put actual numbers behind these generational frustrations, the government spending watchdog group Open the Books compared a decade of state level data, tracking how median household incomes grew against how home prices grew between 2015 and 2024. They labeled the difference between those two growth rates the Affordability Gap. The results were stark. In all 50 states, average home prices grew faster than household incomes over that ten year window. All but two states saw a double digit gap between wage growth and home price growth, and in 17 states, that gap topped 50 percentage points entirely.
The States Where Home Prices Outran Paychecks the Most
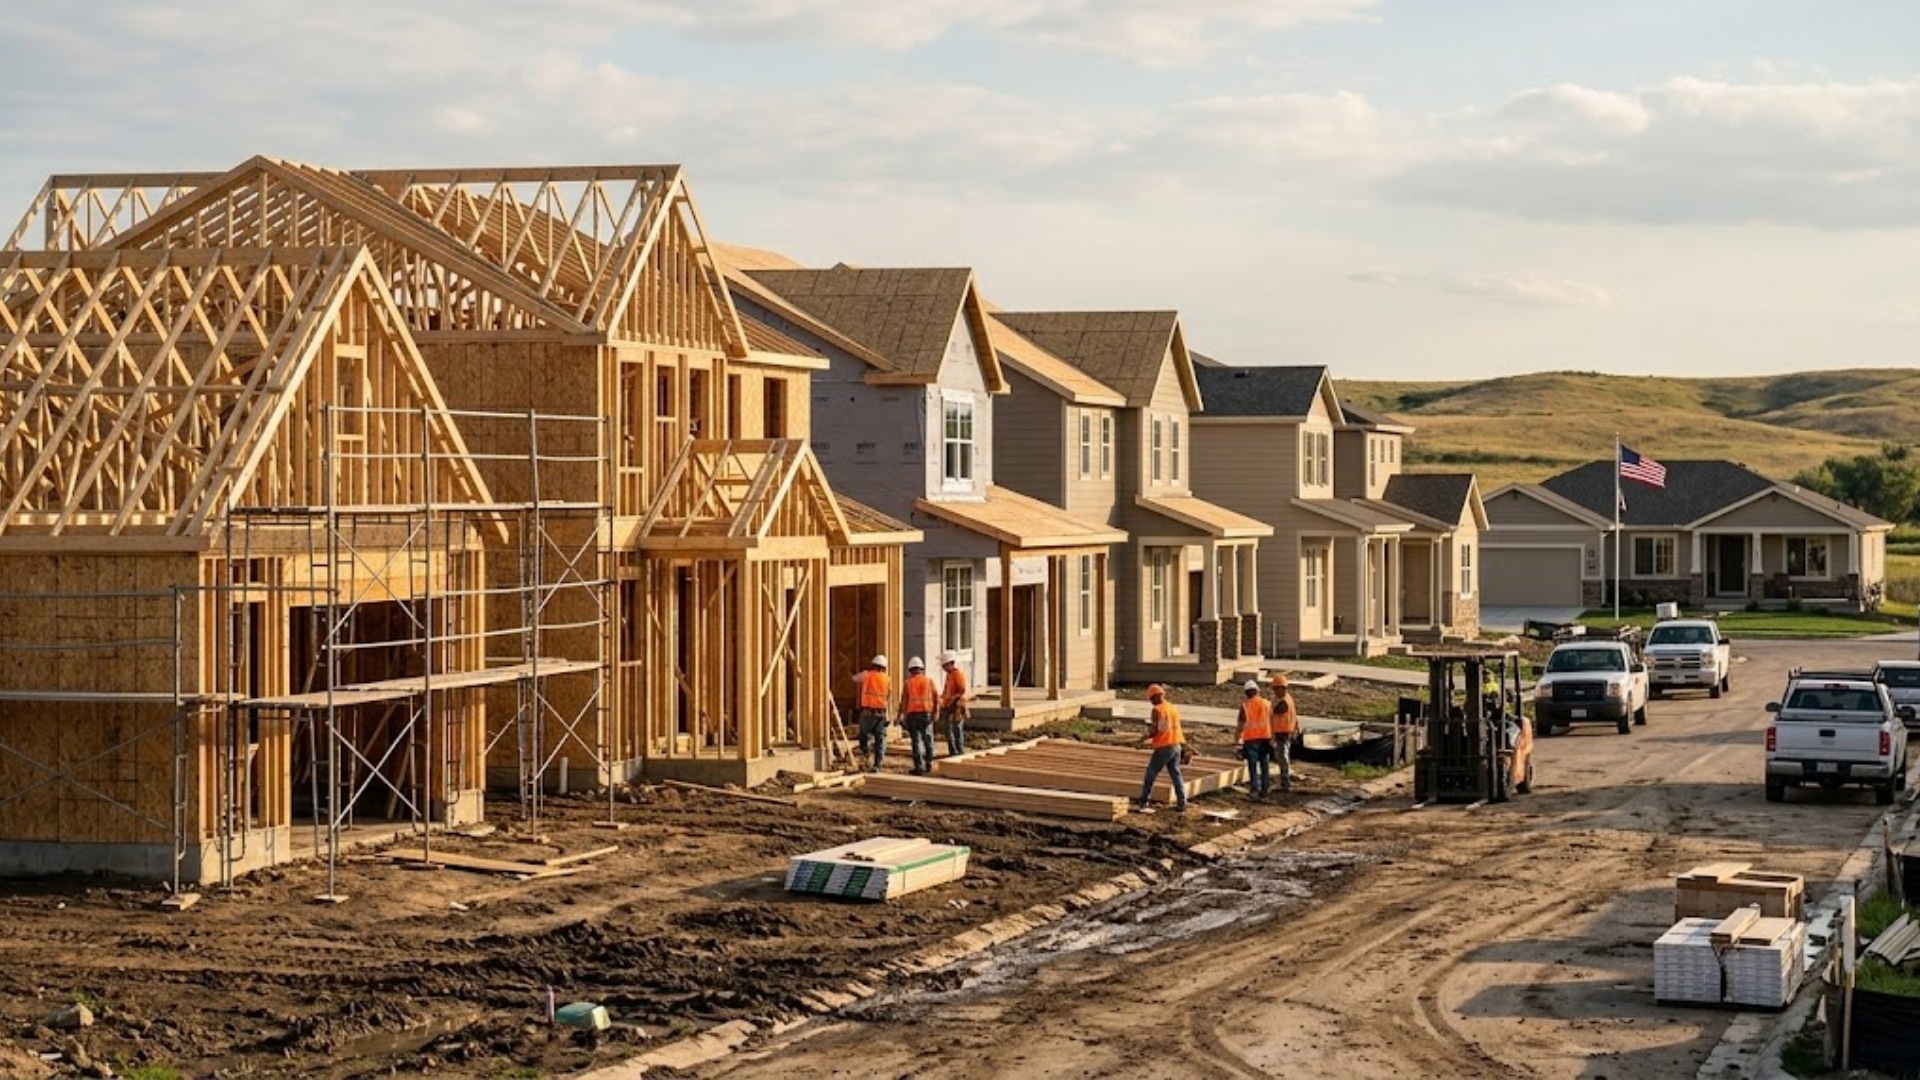
Idaho posted the widest Affordability Gap in the country at 83.33 points, with home prices there rocketing up 151.46 percent over the decade even as the state posted the nation’s strongest household income growth at 68.13 percent. The average Idaho home cost about 332,180 dollars in 2015. By 2024, that same average home ran over 835,000 dollars. Florida wasn’t far behind, with a 77.19 point gap driven by home prices climbing 134.47 percent, pushing average home values from roughly 348,000 dollars in 2015 to about 816,000 dollars by 2024. Both states experienced significant population growth during and after the pandemic years.
What’s Really Behind Idaho’s Explosive Housing Boom

Idaho’s dramatic price surge wasn’t driven by any single obvious factor. The state became known during the pandemic as a low tax, lower density destination for people relocating from larger, more expensive cities. High profile purchases by celebrities including Kim Kardashian, Clint Eastwood, and Jimmy Kimmel likely added extra visibility and demand to certain areas as well. The state’s genuinely strong wage growth, the best in the nation over the decade studied, suggests its economy has been racing to keep pace with rapidly rising home values, even if incomes still haven’t fully caught up to the pace of price increases across the state as a whole.
Why This Isn’t Simply a Red State Versus Blue State Story
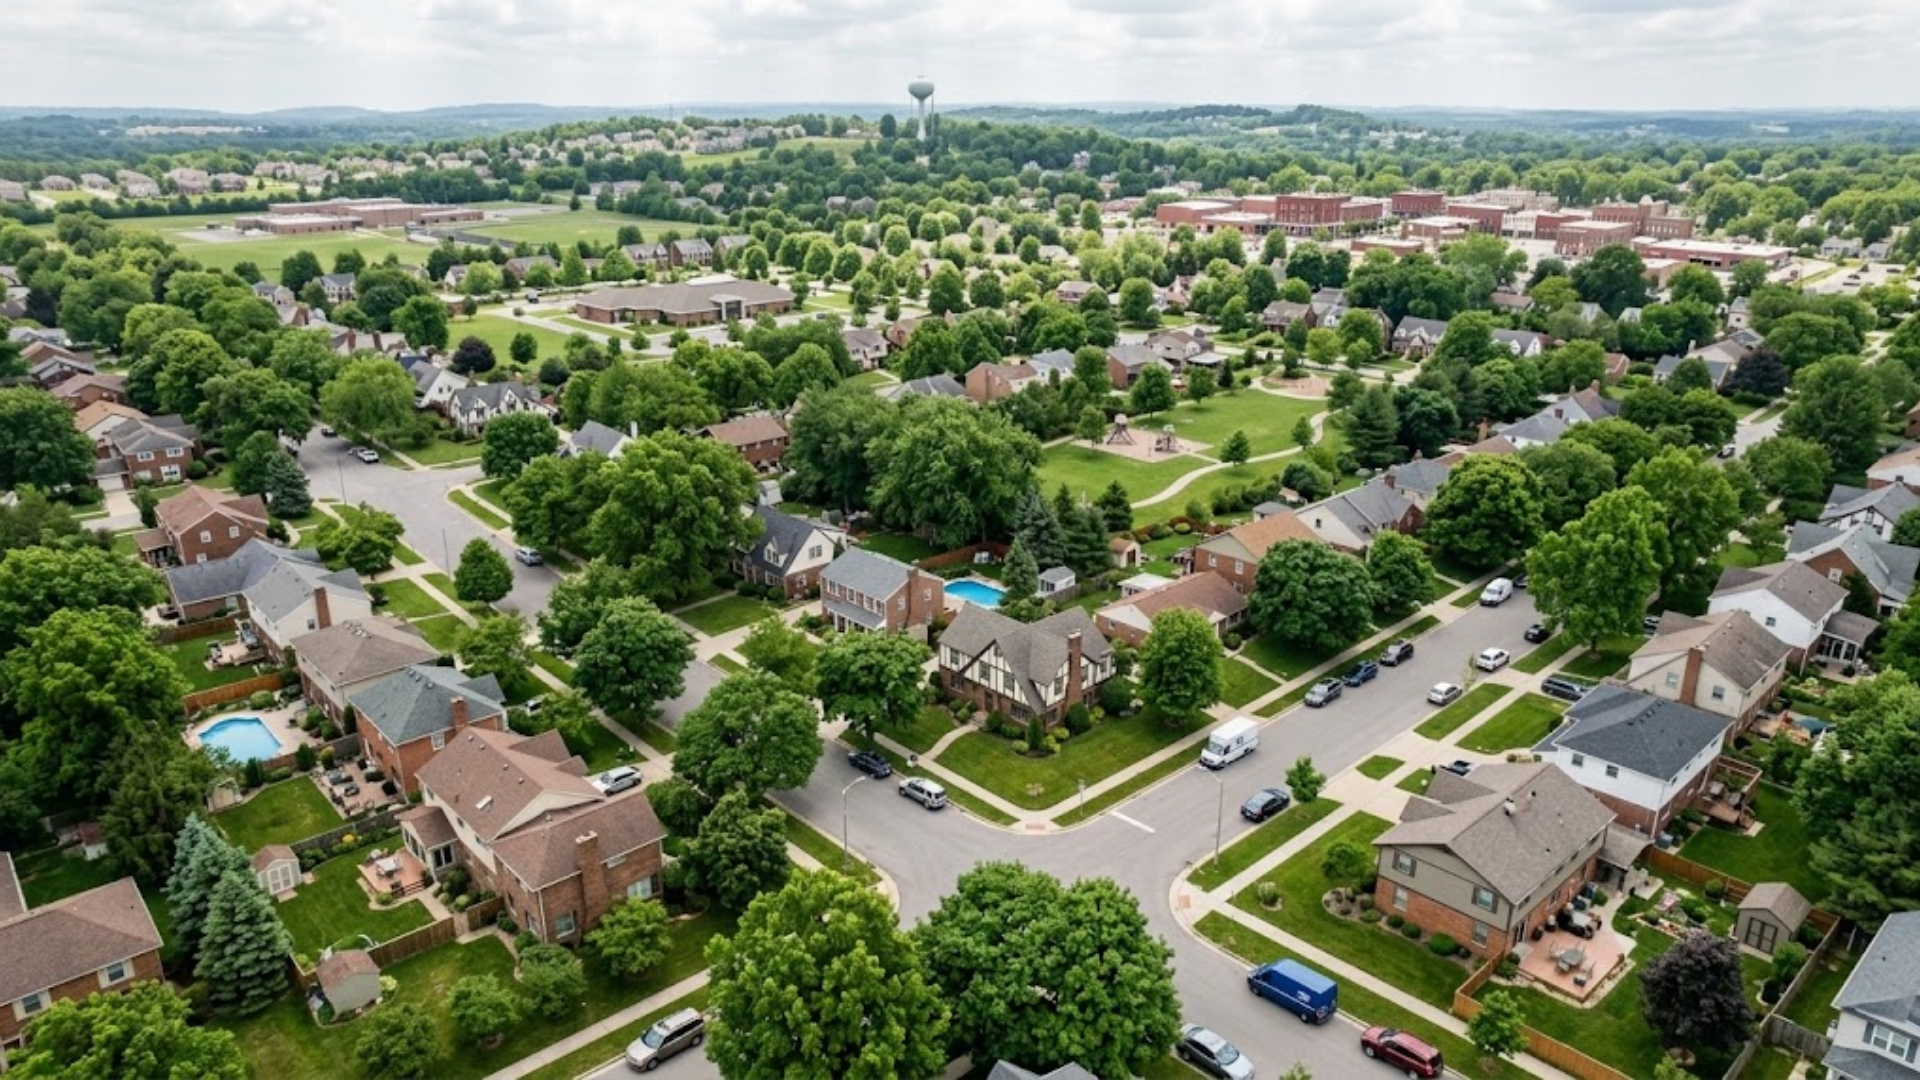
It would be easy to assume the states with the worst affordability gaps share an obvious political or policy pattern, but the actual data resists that simple explanation. The ten states with the highest Affordability Gaps, including Idaho, Florida, Utah, Tennessee, Arizona, New Hampshire, Nevada, Maine, and Washington, are geographically and politically diverse. California offers a useful contrast. Despite its national reputation for a severe housing affordability crisis, California actually posted a comparatively smaller 27.22 point gap, not because incomes grew especially fast there, but because home prices there grew more slowly and steadily than in states like Idaho or Florida, which experienced sharper, more sudden price spikes.
Did Billions in Federal Housing Spending Actually Help
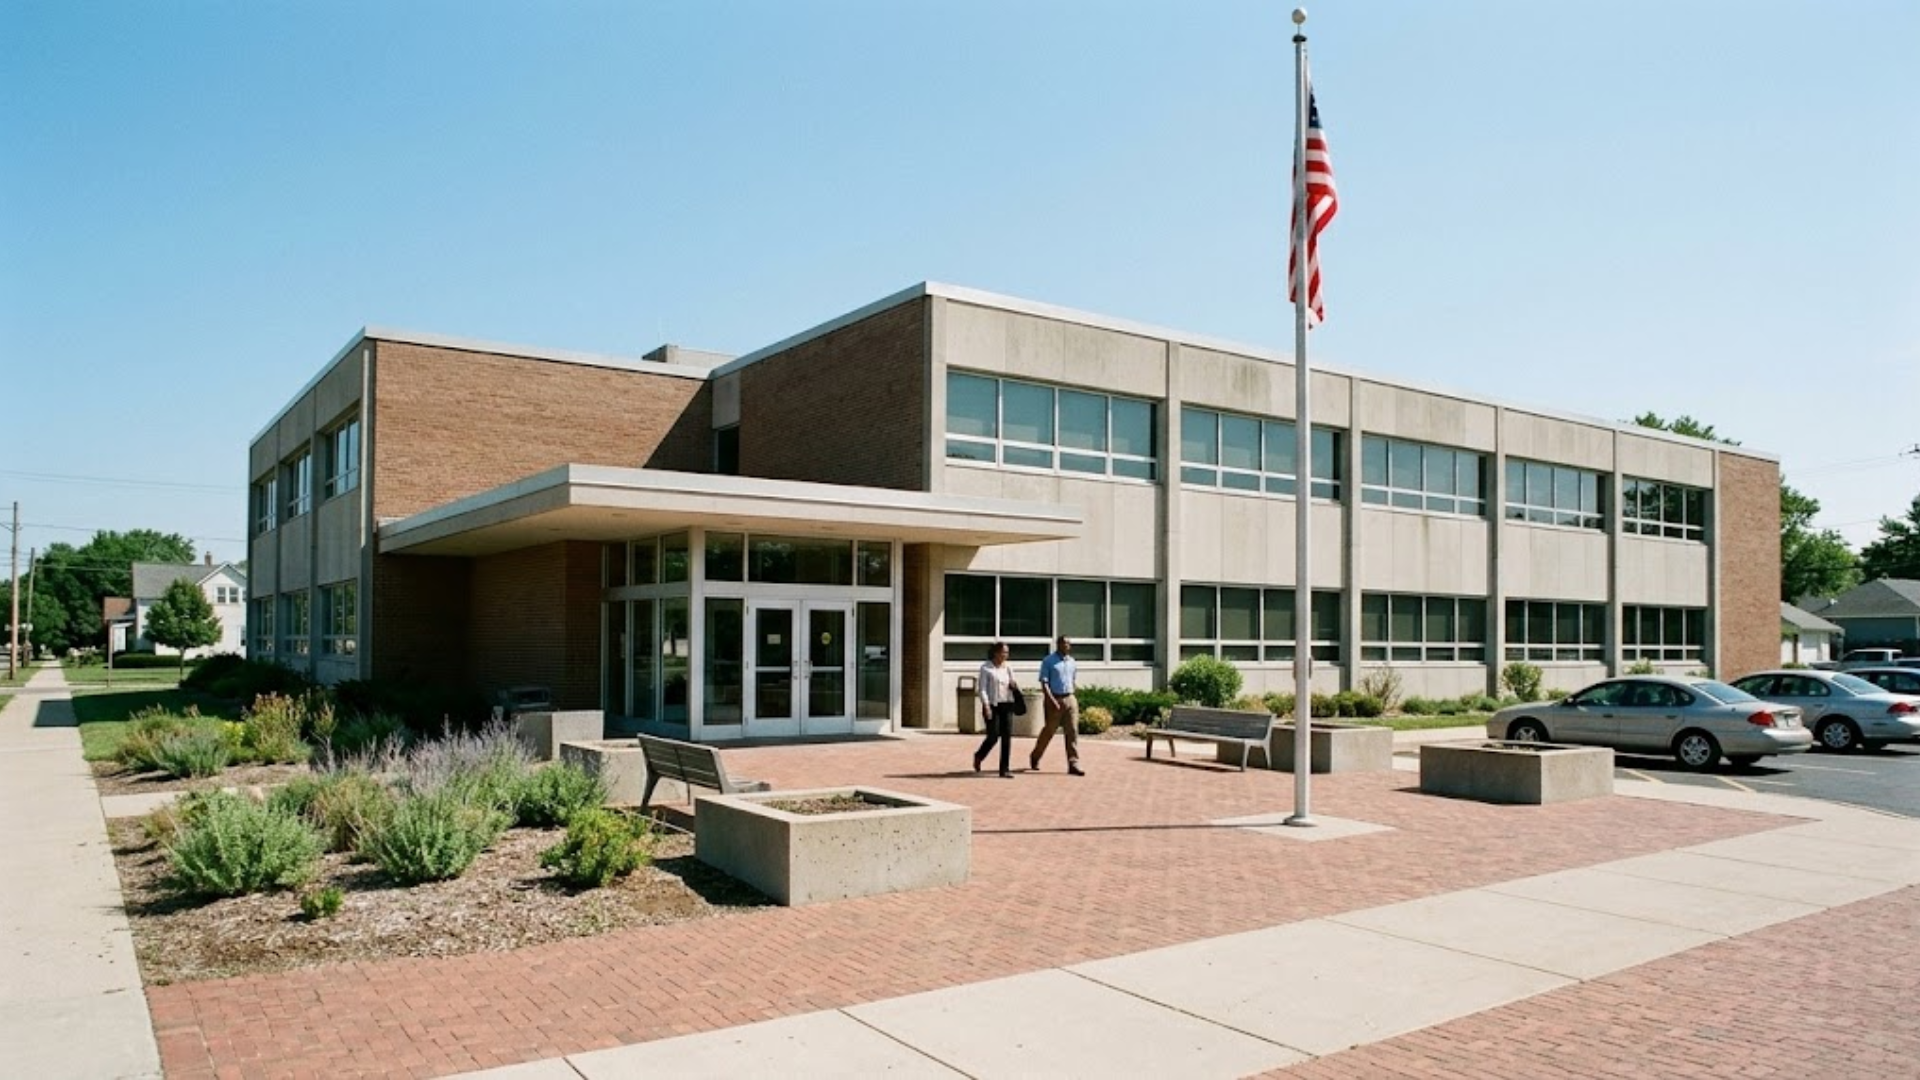
Open the Books also examined whether federal investment made any measurable dent in these state level affordability gaps. The Department of Housing and Urban Development spent nearly half a trillion dollars, about 460 billion dollars, on affordability and low income housing programs over the same ten year period. New York received roughly 59 billion dollars of that total, while California, the biggest outlier, received about 81 billion dollars. Yet when Open the Books compared total HUD spending by state against each state’s Affordability Gap, they found only an extremely weak statistical relationship, suggesting spending levels explained less than one percent of the variation between states, even after adjusting the comparison for each state’s population size.
What This Data Actually Means Going Forward
Taken together, these findings paint a nuanced picture of a shifting American Dream. Younger generations aren’t abandoning traditional goals like homeownership and financial stability, they’re delaying and redefining them in response to a housing market where wages simply haven’t kept pace with prices almost anywhere in the country. The data also suggests that raw government spending alone hasn’t been a reliable lever for narrowing that gap, at least based on the decade examined here, pointing toward other underlying factors like local housing supply, zoning rules, and regional economic dynamism as more significant drivers. For anyone trying to make sense of their own path toward homeownership, the clearest lesson may be that no single formula works everywhere anymore, and success increasingly depends on local conditions as much as personal effort.