Climate deadlines usually sound fixed. Scientists draw a line at 1.5 degrees Celsius and treat it like a finish line we have not quite reached yet. Now fresh research hints that the story behind that number might be far messier than anyone expected. Hidden clues from the oceans suggest our warming timeline might need a serious rethink. Before jumping to panic or relief, it helps to unpack where that new idea comes from in detail.
Paris Climate Goal At 1.5 Degrees
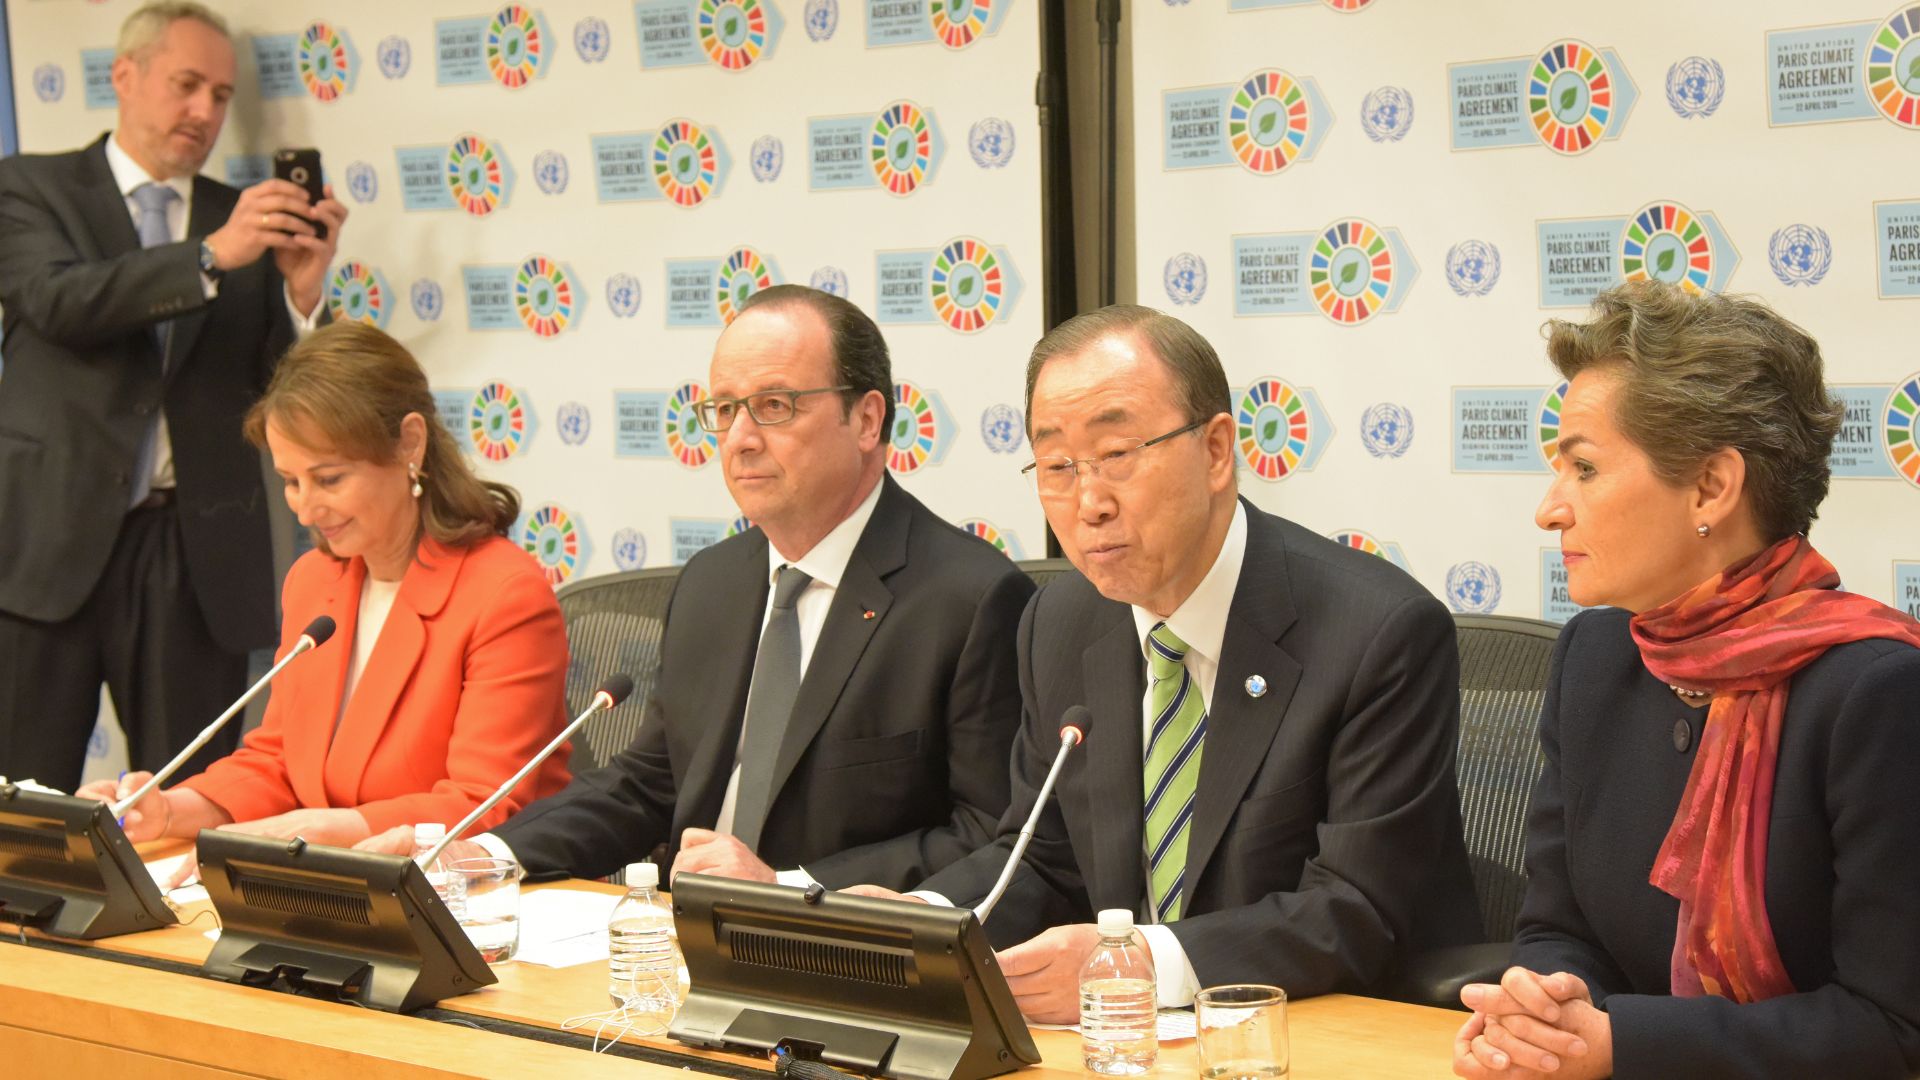
The Paris Climate Agreement set a target that almost everyone can quote now. Keep global temperatures under a 1.5 degree Celsius rise compared to preindustrial levels. The idea grew into a clear guide for climate planning, so it shaped policies and public goals around the planet. Many people treat that number as a guardrail, and it became a reference point for tracking how fast the planet warms and how close we get to long-term heat trends.
Sclerosponge Temperature Records
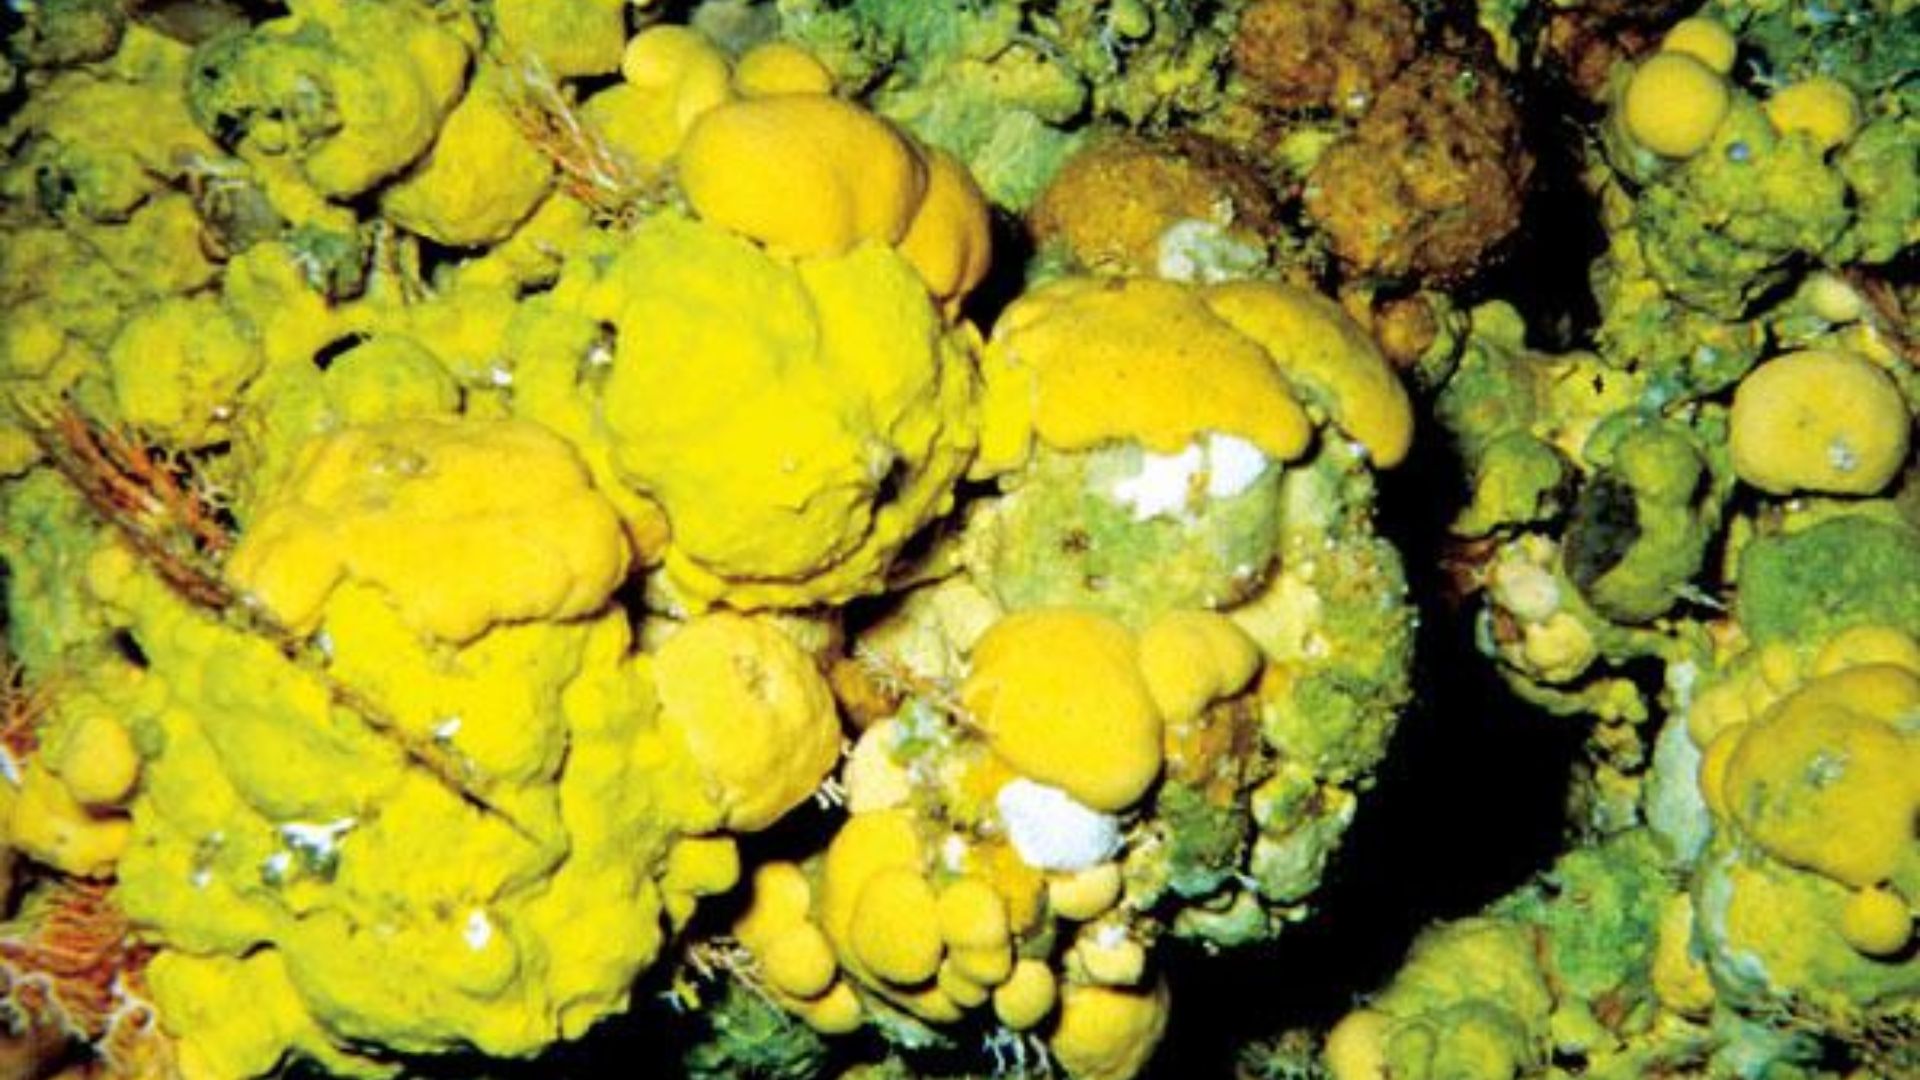
Researchers turned to Caribbean sclerosponges because their slow growth locks in long-running temperature clues. Each tiny layer holds chemical signals, so scientists can track ocean heat shifts far beyond the years covered by direct measurements. The team studied six sponges and used their mineral patterns to outline conditions reaching back to the 1700s. The samples offered a steady record that caught attention and gave scientists a fresh way to look at long-term warming trends.
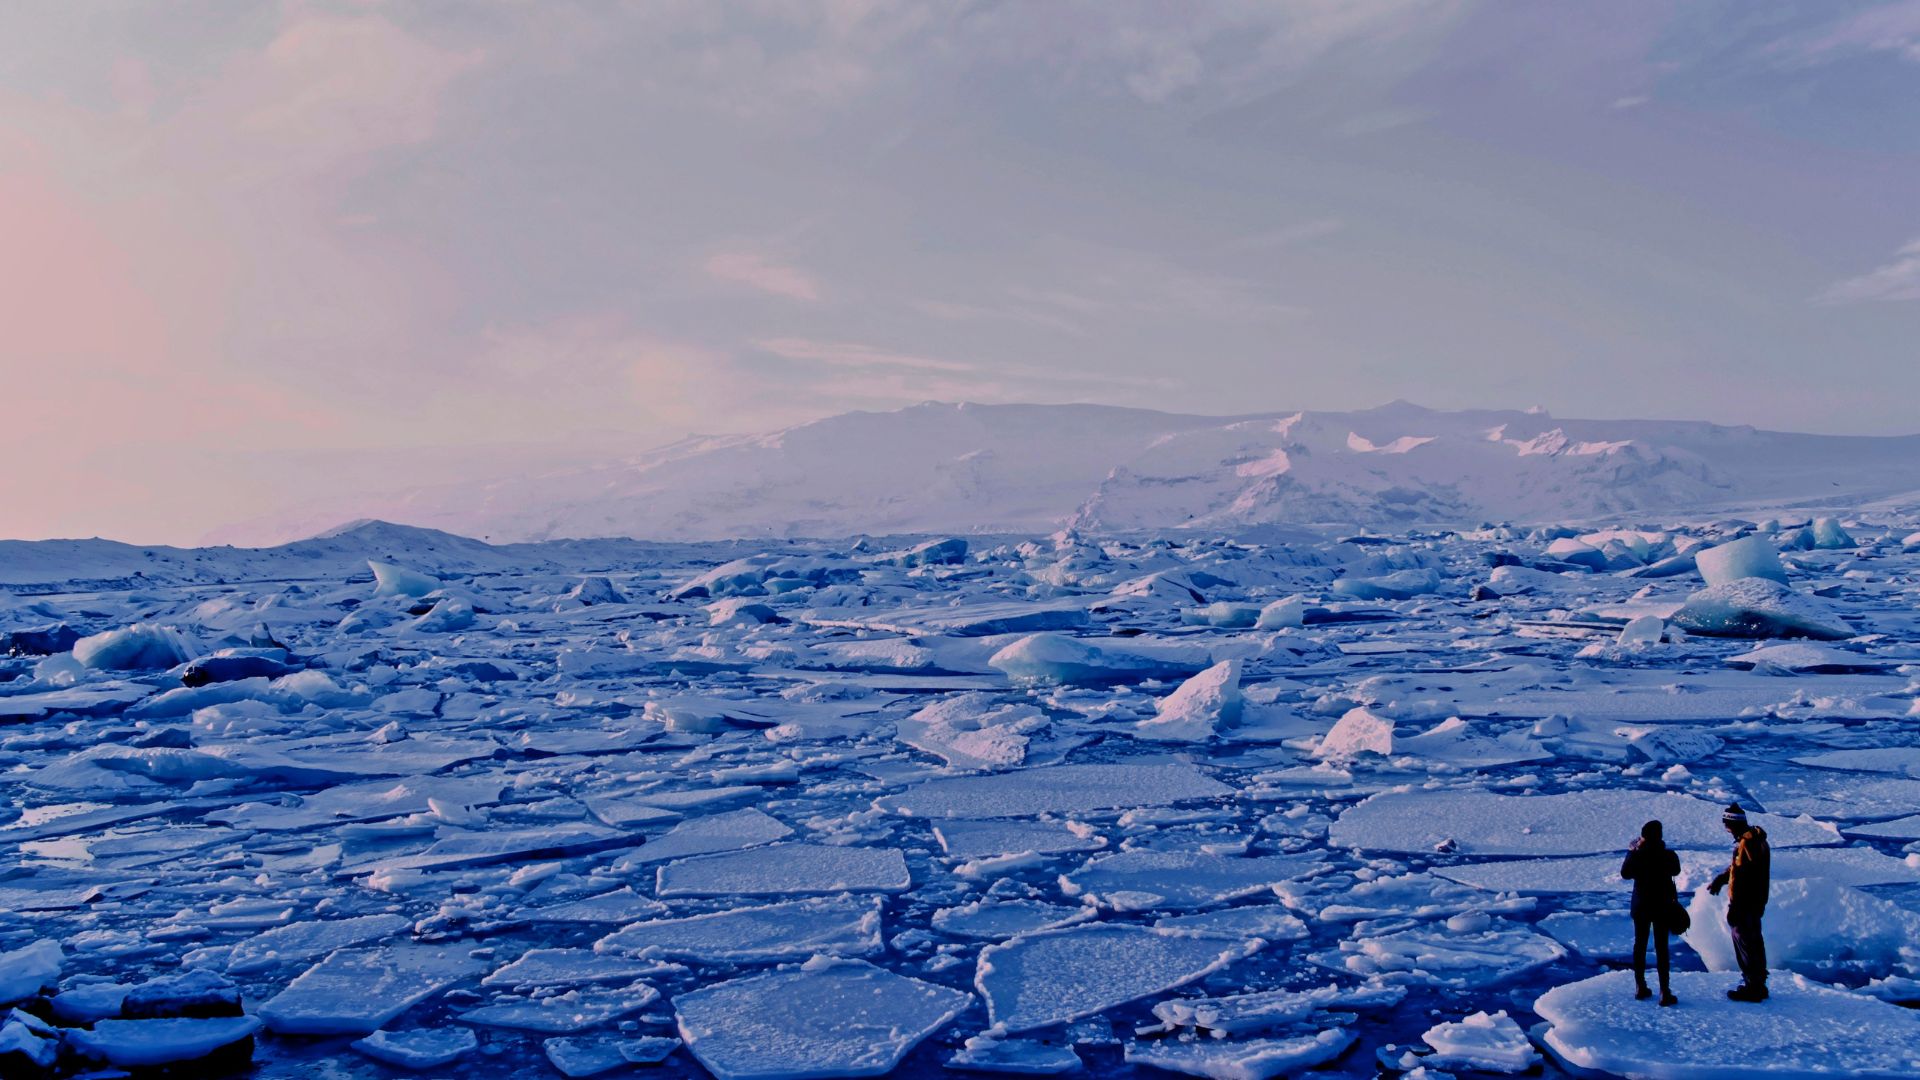
Caribbean Cave Sampling Site
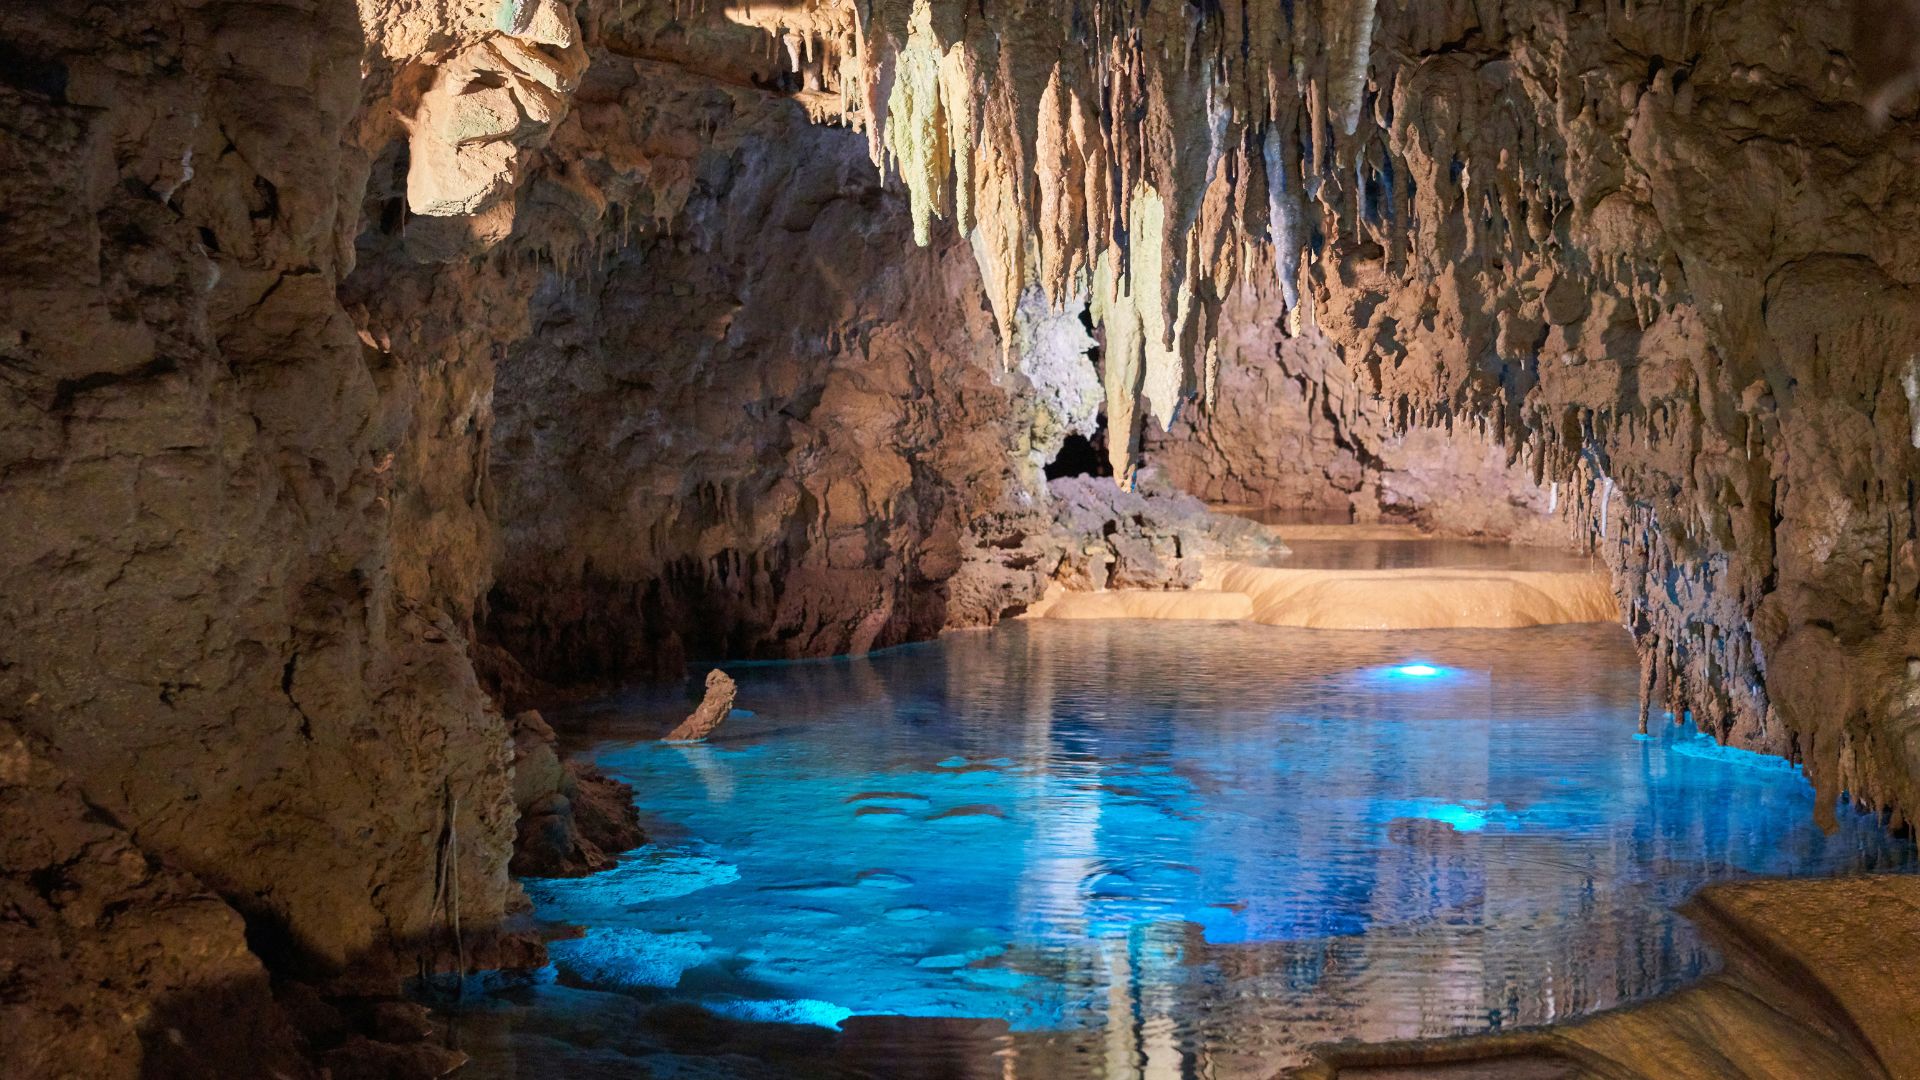
Researchers focused on a quiet cave site in the Caribbean, and the location mattered because the water stays steady enough for clean readings. Strong currents rarely disturb the area, so the sponges grow in conditions that reflect long-running temperature patterns. The team gathered samples from that spot and used them to build a timeline that stretches far back. The cave setting offered a consistent environment that helped scientists track changes across centuries.
Strontium Calcium Ratio Method

Researchers studied the sponges through their mineral makeup, so they focused on the balance of strontium and calcium inside each layer. That ratio shifts with water temperature, and the pattern helped scientists outline heat changes over hundreds of years. The method gave them a way to read past conditions without relying on older ship records. Each tiny change in the ratio served as a marker that pointed to how warm the surrounding water had been.
Rethinking Preindustrial Baselines
Researchers normally use the mid-1800s as the preindustrial starting point because early ocean readings came from sailors who collected water with simple tools. A new timeline drawn from sponge samples suggested warming may have started decades earlier, so the baseline might shift if more evidence supports it. The idea raised interest because it affects how scientists measure long-term change and how they track the pace of rising temperatures across the planet.
Skepticism Over Regional Data

Some scientists urged caution because the sponge data came from one Caribbean site, and they want proof that the trend appears across other regions. One researcher said it feels hard to accept a major shift in the global record based on a small set of samples. Others also asked for more studies so they can compare results and see whether the findings match broader patterns. The debate grew quickly and pulled in experts from different fields.
Recent Temperature Spikes
Recent readings pushed the conversation forward because January reached 1.7 degrees above preindustrial levels, and that marked the hottest January on record. Scientists pointed out that the planet stayed above the 1.5 degree line for at least a year, so it signaled a rapid climb that caught many eyes. The pattern also added pressure to check older baselines again and see how current warming lines up with long-running trends that researchers continue to track.
Emissions Cuts Urgency
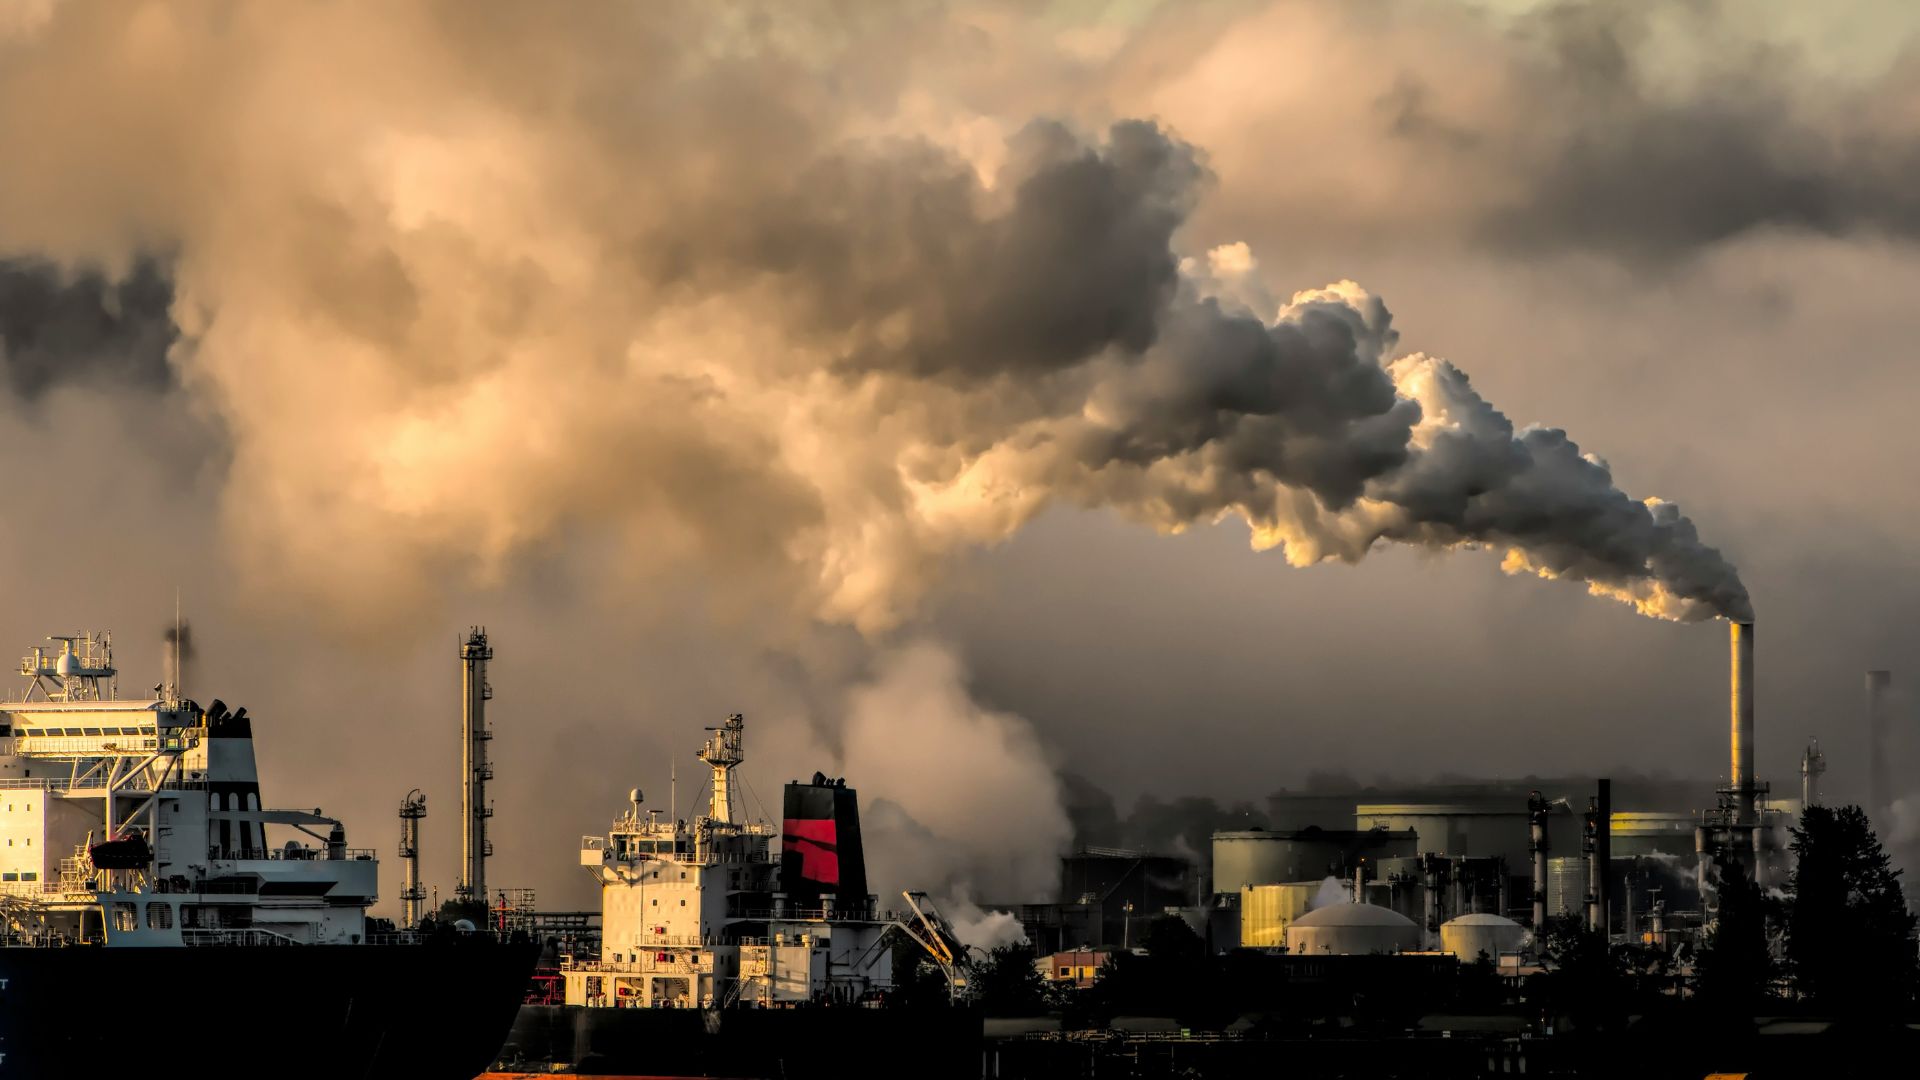
Scientists pointed out that quicker warming estimates shorten the time we have to cut emissions, so the study added fresh pressure to act sooner. Malcolm McCulloch said the warming clock moved forward, and that idea caught wide attention. Many researchers now watch how governments respond because steady heat records keep stacking up. Public interest also grew since the updated timeline suggests we need faster steps to lower pollution across major sectors.
What Comes Next For Our Warming Timeline

Scientists keep digging for answers, and the sponge study pushed the conversation in new directions. Fresh data always sparks new questions, so the debate will keep growing as more teams join in. People also watch rising heat records and wonder how fast the numbers will climb. Small clues add up fast, and each round of research gives everyone a clearer picture of where the planet heads next.